
Performance and Load Testing
A second theme of interest that came up repeatedly at STAR Conference last week was Performance and Load testing. Many of those raising the question, had mobile applications or some form of mash-up or worked in Agile environments were performance and functionality were important.
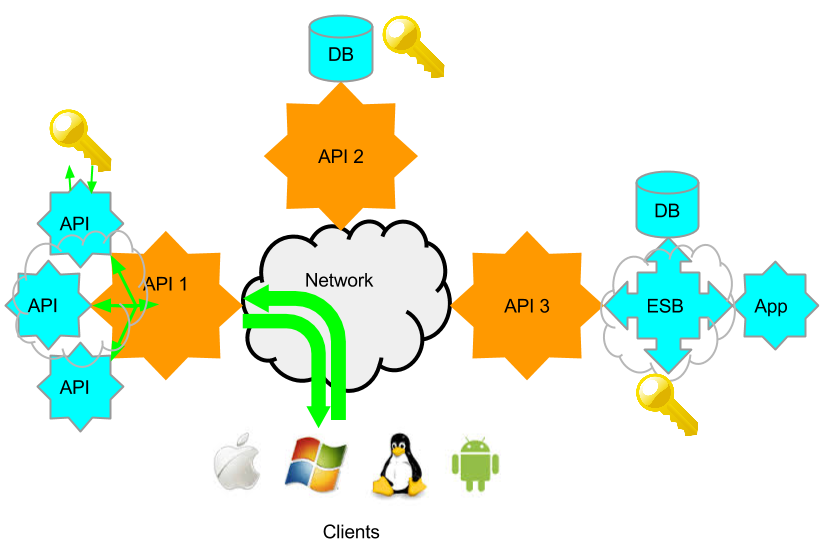
In the SOA or API world, when I refer to Performance, I am referring to a single functional service request to response time taken. The performance of the service as part of the API or web service itself. In the below diagram, it would the time it leaves the client to the time a response is received. The additional API and Identity requests that happen behind the API 1, included. These I refer to as enablers. API 2 has a DB and its identity system, and API 3 is on a Enterprise Services Bus, and has multiple enablers on the bus. Each API may have a number of services associated with it, and each of these may require different enablers, or complete different functions, and so will have different performance characteristics. Granular performance information is therefore important for troubleshooting.
Load Testing, is the performance group of services at a given load. Modelled, using expected behaviour. If function 1 in API 1 is expected to be accessed 5 times that of function 1 of API 2, then the model needs to load Function 1 in API 1 5 x that of function 1 API 2. Load testing can either be throttled to evaluate performance times at a planned TPS or simply increased till errors start occurring, to understand maximum TPS possible.
User experience performance is the perceived performance via a given client. Here we add the performance of a given client to that of the network, API and enabler. User experience does not embrace device / client diversity. Caching, partial screen refreshes, and a variety client tweaks, may hide some perceived performance issues. That said, unless the API performance is know, a poorly performing client can be difficult to identify.
The most common performance issues that tend to come up, are problems not with the API themselves, but with the enablers. Some back-end database, identity system or ESB that may have some other process running on it at a given time (e.g. backup), has a network issue or requires tuning. Often these issues are due to changes in the environment or only at a given time. A single load or performance test run, a few days before final acceptance, often fails to identify these issues, or the issues occur in production at some later date.
I previously wrote a long multi-part series about performance troubleshooting in mobile API and I have no intent to repeat that. The constant surprise however, when I show a shared test case being used for functional and performance testing, is why wanted to add some clarification. Usually I get a blank stare during a demo for a few minutes before a sudden understanding. So many QA testers have being trained to think of different tools and teams for functional and load testing, that the concept of a integrated tool can be difficult to grasp at first, requiring some adjustment in thinking.
After the adjustment occurs, I consistently get the same 2 questions
- “Does that mean you can define performance as a function of success criteria?” Yes, each test case for each service in each API, can have a minimum or maximum response time configured in success criteria. Say you set that value as 1 second along with any other criteria for success. If at any time later on that test is run, including load testing, the test case will fail. There is no need to create new test scripts, data sources, variables etc for load testing in a separate tool. If its a new team, just give them the test case to run.
- Does that mean you can do continual testing or regression testing, on production system and identify any changes in functionality AND performance at the same time? Yes. If the value is set at 1 second response in success criteria, and you configure a automated regression or functional test every hour/day/week/ whatever. If at any point, performance or functionality changes, the test case would now fail as the response would be different than expected or previously. There is no need to run 2 separate applications to continually test service for changes in functionality and performance.
At this point I usually point out the benefit of physically distributed load agents vs. just virtual users. The ability to trigger a central test from multiple locations in your network and compare response times, allows not only the simulation of Server, but also the Network. Larger companies often break out network performance turning into another team, and don’t consider it an “application issue”. I believe any performance issues is functionally important. Smaller companies, and senior executives, are however quick to the benefits or consolidating this into a single tool and report.
Conclusion
Regardless of if your performance/load team is a separate group or part of your role, sharing a test case, and actually building performance in to the success criteria in the same tool can offer huge benefits in time savings and in identifying performance issues earlier in development cycle and during maintenance. Why not try it yourself? Here is a two tutorials on Load Testing and Geographically Distributed Load Testing.