Search for:

More Detailed look at Service Planning Costing Part 1

In an earlier series, I went over a number of costing models that I have come across, that are used by different organizations. Service Planning Costing being one of the more detailed and specific, and often used by outsourcing companies. What is most interesting around service plan costing, is that a change of a single iteration, or minute in testing time can have major impact to the total price for the project. That said, I have seldom met an organization that has statistics or KPI on test times.

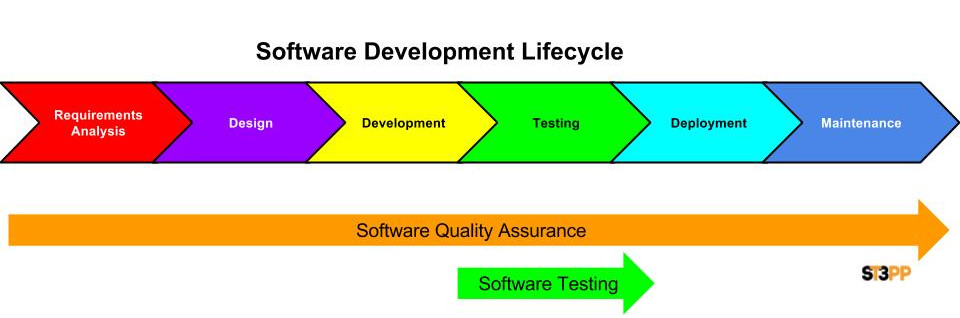
To understand this better, lets look at Testing as just one part of the Software Development Life Cycle.  The majority people experience higher testing costs during product maintenance than development, yet at that point expenses have settled and are generally known. During the testing phase however, there are many more unknowns.

Testing Levels

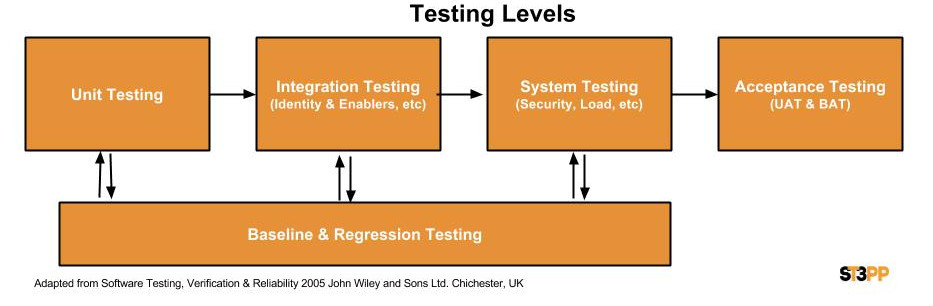
During software development testing, there are a number of different levels or test types. The first and most common test is the basic unit test, testing a function in the service to ensure that it does what it is intended to do. Each time the code is revised, a unit test is usually run to ensure that nothing unexpected has resulted. At some point, code is consolidated in a “release drop” and Integrated testing is done. Integrated testing, ensures that each unit interoperates with the others. Systems Testing is the next level and is around testing the entire system. This includes things like security testing, Performance testing under load, and other specialized tests to cover different environments. At each of these testing levels and each test iteration is usually compared to the previous baseline, in what if normally referred to as regression testing. The final testing level is user or business acceptance testing.  Depending on the complexity of the application and the development approach and the maturity of the organization, there can be anything from 5-50 Testing level iterations. For example, in Agile environments, the sprints are usually shorter, yet need to include each of these test levels, while in waterfall, a company may only begin integration testing once all unit testing is completed.

Test Cycle


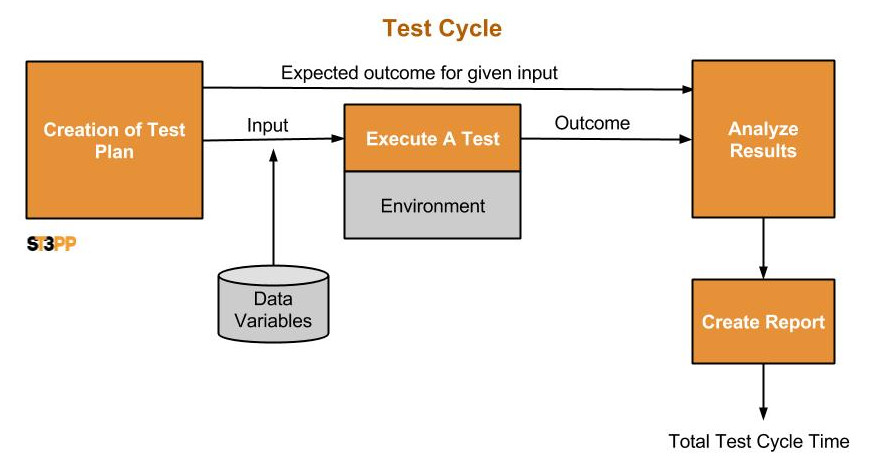
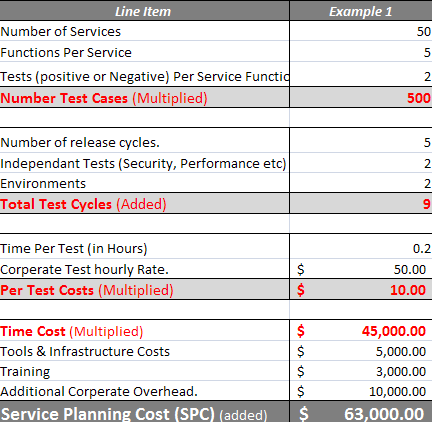
Now each test Iteration at each testing level follows a process. A Test plan is developed, and the expected outcome along with intended inputs is created. This then is executed in a given environment, and the outcome is compared and analysed against what was expected. Any unexpected results or differences require further analysis. Afterwards a test report is completed, detailing what was done and the result The test cycle can be brief, in a unit test or lengthy as it may be in acceptance testing. In a single web service, there may be 10-20 function and each function may need to be tested. Possibly with a positive and negative or some other boundary requirement. The result could be hundreds of test cases for a single web service. Thousands of test cycles can make up a single test level and each test level can be repeated with each code drop or systems change. Since employee salaries are the largest costs in software testing, its makes estimating these times essential.

Since each of these processes is repeated exponentially, a small variance of a few seconds allocated to each test cycle or to the number of test levels in costing, can result in huge impacts to the costs. This is especially difficult to manage, when environments, code releases and other parties invested n the process may not appreciate the costs impacts.

This touches on core issues with QA and testing costs. I will be speaking more on this Tomorrow at TASSQ meeting in a workshop, and in future posts. Drilling down on some thoughts on how to reduce the costs and increase the accuracy of costing. In the mean time please feel free to comment below.

ST3PP Presenting at TASSQ in March

Join us at TASSQ this March the 25th in Toronto at the The Albany Club – King & Church Streets 5:30 pm networking 6 pm dinner 7 pm presentation. March’s presentation will be done by ST3PP’s me, Ivan Flowerday. Visitors and new members are always welcome at TASSQ and attendees include anyone who has an interest in software quality, or software testing, whether they work for a large corporation, a small software house, or whether they are independent consultants.

ST3PP’s mission is to Align the domains of Tools, Process and People, to achieve excellence. At TASSQ, I will be sharing some thoughts and ideas collected by meeting with a number of QA and Development organizations. The session will also be interactive, with attendee participation.  Although it will cover all 3 domains, no specific organizations Tools, People or Processes will be used. The intent being to generate ideas or thought that members can further investigate, and perhaps apply in their teams. Similar to much of ST3PP ahead newsletter.

To give you some idea of what I will be discussing you can read a detailed look at service plan costing

We look forward to seeing you there and please stop by an introduce yourself if you have not already.


KPI – Identifying Areas in Process that Requiring Tuning

Both Six Sigma and CMMi focus on creating and managing a feedback loop. Assessing the current status in your organization and then identifying areas for improvement.  To do this, KPI or Measurement Objectives are needed to measure the effectiveness of your organizations Tools, People and Processes. Measuring details like Defect Density, Test Coverage, Total defects, reliability etc. Then collecting the relevant data and analysing these measurements to provide insight into the the results, set goals and track progress.

One of my favourite tools or methods to visual and analyse KPI is via Pareto Graph. Its simplicity makes the 80/20 rule stand out to any level of an organization. In the above example the first 7 groups of defects is clearly well over 80% of the all defects. The impact of addressing the others being minimal, while a small change in the first 3 could have major impact to your organizations quality.

Potential issues with Pareto Graph.

Although extremely helpful in identifying areas that need to be addressed, there are some potential pitfalls on relying on Pereto analysis too much. These include

  1. It is important to define and group the categories correctly. They need to both be precise, so that there can be little doubt as to which category the defect fits into and they need to be of a suitable granularity. Making larger groups, can make addressing the sub issues in the groups difficult, yet making too many sub-groupings can result in loosing the visual effect and intent of the pareto.
  2. Selecting appropriate time periods is important. Measuring only a single release cycle or team, can result in wild fluctuations in results. Consolidating multiple teams, releases etc can cloud visibility into a particular team or release issues.
  3. If changes are made to the Tools, People and Process, to address the issues identified in the  pareto chart, adding them to the same period will not offer any insight into the effectiveness of these changes. These changes need to be compared to a previous baseline. Baselines however can become rapidly dated.
  4. Pareto analysis is draws focus on areas of greatest need, but a laser focus only on those areas, can rapidly destabilize others. Some of these other fixes could be potentially low hanging fruit requiring little effort to resolve.
  5. Although Pareto analysis identifies common areas that may require focus or consideration, it does not supply solutions.

Poll

What I have learnt is that when someone sits down and actually gathers the information and generates a Pareto chart for analysis, they are almost always surprised by what is revealed. For benefit of all,  I wanted to take a short Poll.  First off, looking at teams that do use pareto analysis and teams that don’t.  What I would be interested in seeing, is if these teams see common or different set of issues. In other words, does doing a pareto analysis change peoples list of most common defects. The results will be collected privately and consolidated by me, and posted at a later date. Comments at the bottom of the page posted before hand for public, but comments in the poll kept private unless you stipulate in them you wish to be mentioned.

Please take a minute to weigh in and help others ST3PP ahead.

[contact-form subject=’pareto analysis’][contact-field label=’Screen Name’ type=’name’ required=’1’/][contact-field label=’Does Your Organization Use Pareto Analysis’ type=’radio’ required=’1′ options=’Yes – we review them frequently,No – I have never seen one for my organization’/][contact-field label=’1 – Most Common Defect Group’ type=’select’ required=’1′ options=’Business Changes – Missing or added business functionality,Design Defects – Missing or incorrect architecture requirements,Developer Defects – Missing or defected functionality in code,Environmental Defects – Versioning%26#x002c; enablers or other other site issues,QA Defects – Incorrectly identified as a defect,Other – Please describe in comments’/][contact-field label=’2 – Second Most Common Group’ type=’select’ options=’Business Changes – Missing or added business functionality,Design Defects – Missing or incorrect architecture requirements,Developer Defects – Missing or defected functionality in code,Environmental Defects – Versioning%26#x002c; enablers or other other site issues,QA Defects – Incorrectly identified as a defect,Other – Please describe in comments’/][contact-field label=’3 – Third Most Common Group’ type=’select’ options=’Business Changes – Missing or added business functionality,Design Defects – Missing or incorrect architecture requirements,Developer Defects – Missing or defected functionality in code,Environmental Defects – Versioning%26#x002c; enablers or other other site issues,QA Defects – Incorrectly identified as a defect,Other – Please describe in comments’/][contact-field label=’4 – Fourth Most Common Group’ type=’select’ options=’Business Changes – Missing or added business functionality,Design Defects – Missing or incorrect architecture requirements,Developer Defects – Missing or defected functionality in code,Environmental Defects – Versioning%26#x002c; enablers or other other site issues,QA Defects – Incorrectly identified as a defect,Other – Please describe in comments’/][contact-field label=’5 – Fifth Most Common Group’ type=’select’ options=’Business Changes – Missing or added business functionality,Design Defects – Missing or incorrect architecture requirements,Developer Defects – Missing or defected functionality in code,Environmental Defects – Versioning%26#x002c; enablers or other other site issues,QA Defects – Incorrectly identified as a defect,Other – Please describe in comments’/][contact-field label=’Private Comment To Me’ type=’textarea’/][/contact-form]


Performance Tuning Mobile API – Introduction

Mobile applications offer a number of unique challenges with regards to testing, adding complexity through an expanding number of variables. Along with usual testing concerns, there is an array of devices, with an uncertain network and the emerging mobile services standards themselves.  Business people wish to focus on the user’s experience, attempting to gain some level of certainty in what is still a very uncertain and emerging world. Specifying requirements to developers and QA that can be extremely difficult or costly or even impossible to validate.  Let’s take a poorly crafted requirement “the application screens will refresh in less than 3 seconds on devices and networks”.

When in field testing, a device consistently requires more than 3 seconds to refresh a screen, what is wrong? Did Developers or QA fail to meet with the requirements? When performance is poor, how do developers and testers pinpoint the problem? Is it even a software issue that can be fixed? Is it perhaps the devices memory/CPU load, the screen size or storage space, the client software, or perhaps bug in that particular version or OS. Perhaps it’s the geographic location of the user, the wireless provider, the type of network the user has, the user’s physical location and signal strength. Or perhaps it’s one particular service, identity, encryption, authentication or some 3rd party service used by the mobile application. There are literally thousands of possible causes and combinations, making it impossible to consider, test and validate them all. Tuning however for the best chance of success is possible.

With the problem being the number of variables, it is no surprise that best practices usually involve dividing these variables into groups and then testing to understand the impact each particular group can have on performance rather than attempting to test for every permeation.  By breaking the entire experience into smaller components, and understanding the impact of each component, variances can easily be identified. Although every organization and application is different,   let’s looks at 4 groups.

  1. Client – The device, its operating system, and applications on it, including the your own.
  2. Network – wireless and wired communication from wherever the client is to the Ethernet port of the API.
  3. API – The Services that are Consumed by the Mobile Application
  4. Enablers – The services, like Databases, Identity, 3rd party etc that support the API.

This can be represented as:

User Experience = Enablers + API + Network + Client.

The next post is on understanding the impact of client and on ways to isolate and understand the impact that client has on your overall performance for troubleshooting.

Calculating QA Costs – Service Planning Costing (SPC)

The series on Costing Models Includes Back In Costing (BIC), Agile Anarchy Method (AAM), and Just Test Something (JTS) Method. The intent here is not to claim one model as king, but rather to evaluate the potential benefits and pitfalls of relying on one model exclusively. My hope being that by sharing these approaches, QA organizations will evaluate their current models and perhaps find room to tune them for greater excellence.

Service Planning Costing is done by calculating the desired number of test cases, then multiplying them by time needed to complete these and the costs for this time. To this you add any additional project costs. It requires a full understanding of the project before costing can be done, and detailed project planning and scope.

SPC Model Inc. is costing a planned project. The new Project will have 50 new web services, each averaging 5 functions in the service. SPC Model Inc standards require a minimum testing one positive and one negative scenario only per service function. By multiplying these numbers together, SPC Model Inc plans require 500 test cases. The project plan calls for 5 expected development cycles or code drops. The security team will need to run their set of tests and the performance team theirs. They also need to do a final lab and production implementation test. Its estimated their current team skills are at a level were each test case will take an average of 12 min to develop and complete and the corporate rate is $50 per hour for QA resources. Finally they plan on purchasing a new tool, 2 lab machines, training and need to pay for hiring and on-boarding new employee. The Service Planning Cost (SPC) is seen to be $63,000 for this project as per below.

SPC Base

The SPC model is focused on breaking the testing down into as many small pieces as possible and assigning a value to each piece. Variations are possible using averages across the project or breaking the project down further into stages. For instance, First release may have less test cases or services, Security test could be a separate calculation or hourly rate could include training and hiring. The more granular, the more likelihood of accuracy, but the greater the risk of inaccuracy. Numbers like release cycles and time per test can inherited through by reviewing previous similarly projects or through running short pilot. Whatever numbers are used, it is still based on plan and plans can go wrong.

Advantages.

  1. Although some of the numbers may come from previous projects, the actual costs are based on real target project scope.
  2. The model supports organization test coverage standards or objectives. The number and extent of test cases is planned for positive, negative, load, security etc.
  3. Very easily communicated and aides understanding between on-shore and offshore teams and management, ensuring all parties work to the a defined plan. This is one of the reasons for this model to be popular with outsourced organizations to reduce project risk and clearly define the scope to prevent scope creep.
  4. Timelines, gates, KPI and milestones are known
  5. Inefficiencies can readily and clearly be identified and costs easily understood. For instance the cost of an additional code drop.

Disadvantages

  1. The line items can be very subjective, hence vulnerable to padding or underestimating. A very small mistake in any line item is compounded and can result in significant over/under costing. For example change the individual test case time by 2 minutes average.
  2. Does not allow for much flexibility in changing the plan. For instance, a particular service may perhaps warrant additional testing or an additional requirement or unforeseen services added.
  3. Still dependent on other parties delivery. What if a extra code drop becomes needed due to a previous issue not being fixed correctly
  4. Relies on a totally flexible environment. A testing team cannot always be expanded or contracted in real time.
  5. Does not support agile development model well.

CONCLUSION

Service Planning Costing (SPC) is not a silver bullet, or exact science and it does not prevent misuse through padding to target a desired price or outcome. It can however be a extremely valuable tool for analyzing expenses, identifying inefficiencies and managing KPI. These KPI can be used one project to the next, and “tuned” over time to plan better.

I will be covering more around these KPI and on understanding better how an organization, or individual,  may focus on the SPC model to “Dial In” for excellence in future posts and at my TASSQ presentation.