Search for:

6. SOAPSonar – Report View

An important reason for Automation, can be the time saved over generating manual reports. Comparing expected results with actual on a case by case basis and sorting through this date to combine it in a meaningful way. Making sense from pages for XML, in an attempt to filter the few key issues. One of the top 5 issues shared with me is false positives, or QA reporting an issue, that was either incorrectly diagnosed or not considered a issue. Much of this can be mistake in what was entered, but just as often, a mistake in understanding the expected behaviour.

SOAPSonar Test Cycle

So lets take a look at SOAPSonar’s report view, carrying on from the previous Tutorial #5 defining success criteria.

1. Lets start this time with JSON Google maps. In QA Mode, Project View. Please confirm you have the service and the [ADS] and that service works. Switch to Run-View and clear any tests under the DefaultGroup and drag over only the Google Maps test case we did in Tutorial 5.

1 Starting out

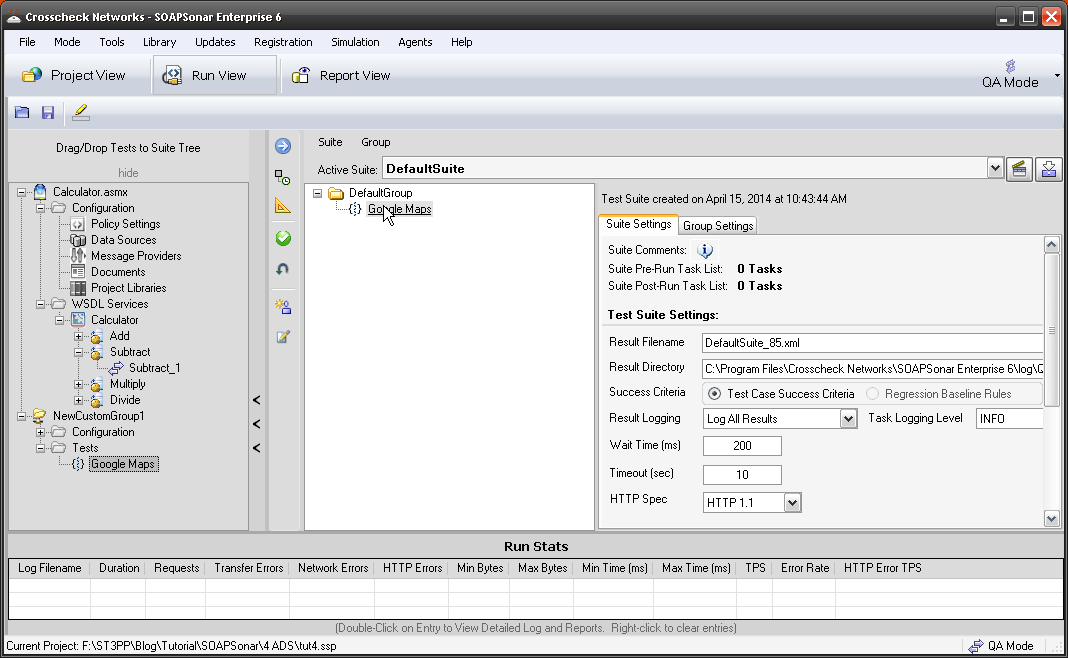
2. look at the area to the right, In QA Mode there are 2 tabs. Suite Settings, and Group Settings. If you switch to Performance mode, there are 3 different tabs. In QA mode, lets change the Result File name to Tut6_1.xml and leave the location at C:\Program Files\Crosscheck Networks\SOAPSonar Enterprise 6\log\QA. We have not captured a baseline for regression testing, so select Test Case Success Criteria. Result Logging as Log All results and Verbose and Use Optimized XML logging. Warning, Logging all and verbose logs in large test environments can greatly effect performance and seriously load any workstation. We usually recommend log errors fails and errors. HP Quality Centre and other options, leave unselected.

2. Verbose

3. On the Group Settings tab, lets leave things default. Here you can define a Data Source table to run through multiple tests. Commit and Run Suite.

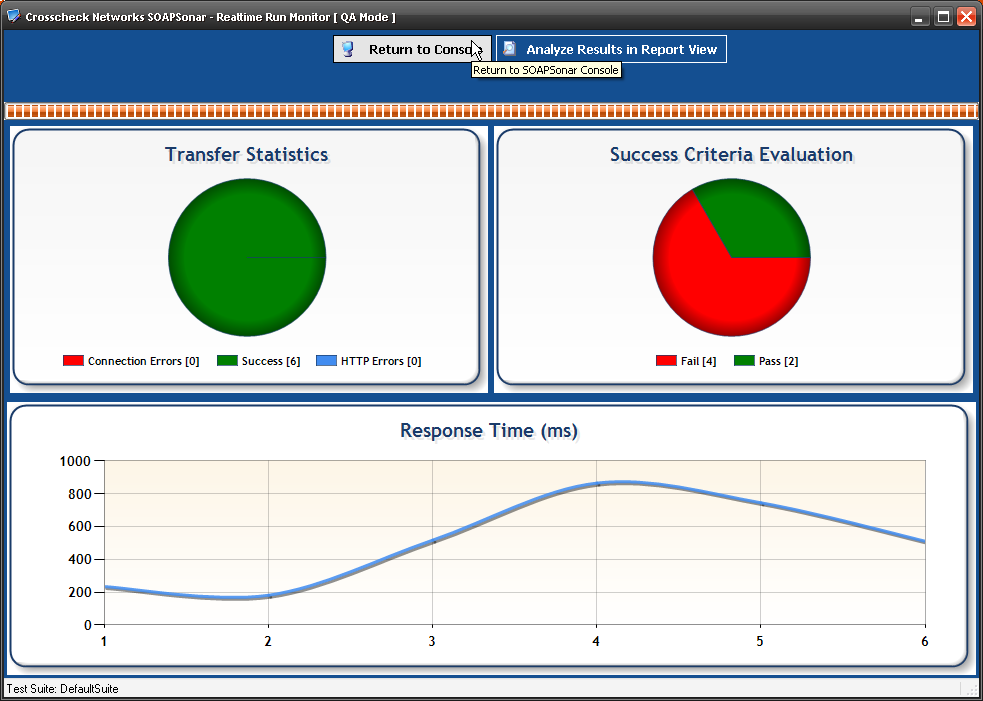
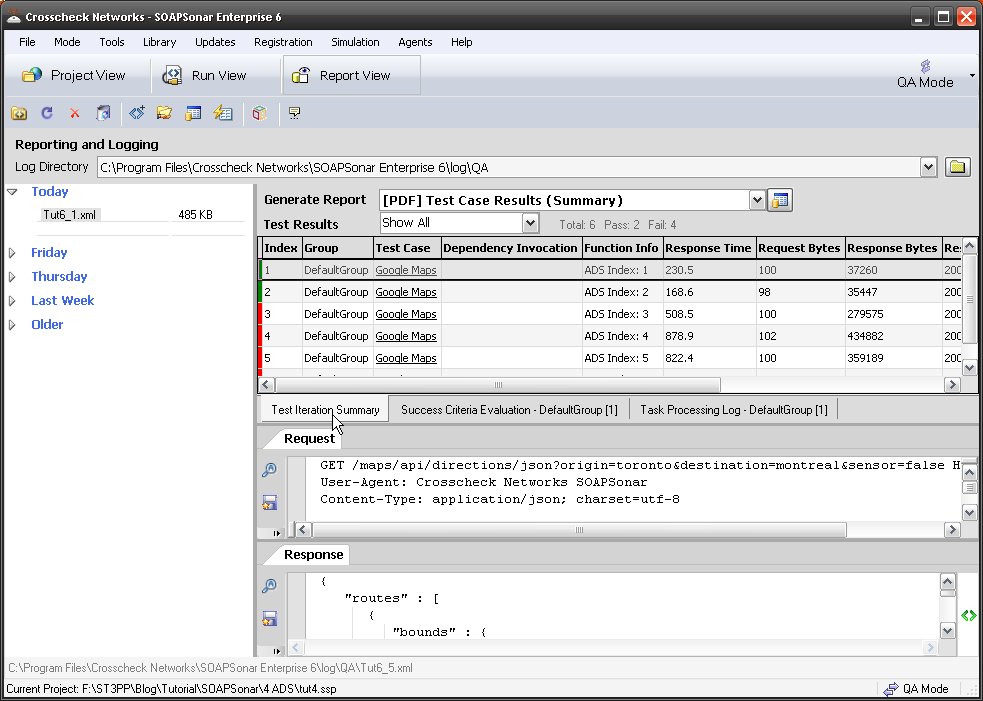
4. Realtime Run Monitor shows that I ran 6 test cases of which 4 failed and 2 passed. Select Analyse Results in Report View at the top of the page.

4. Realtime

5. In Report View, we can now see on the far left, under Today, I have Tut6_1xml Log file at the location we entered in step 2. Right Clicking on the file allows you to export Request and Response Data as Files and Export Results to Normalized XML. Select Export results in Normalized XML and you have details of each test case run.

5 Log files

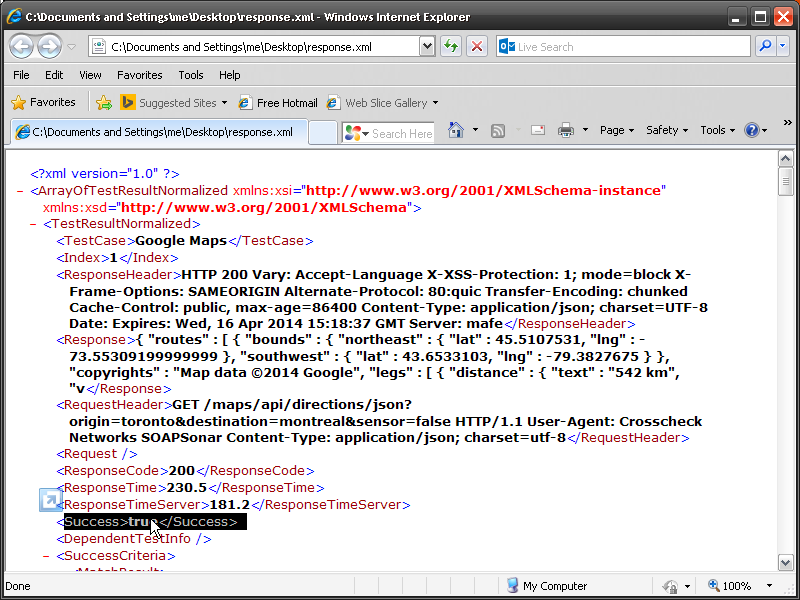
6. In the main section you can see the first 2 tests are green and the rest red. Selecting the first test, and the tab Test Iteration Summary and the Request Response Tabs populate with the what was sent and received. Do you notice the exact time for and size of each message is also reported along with teh response code?

6 First Test

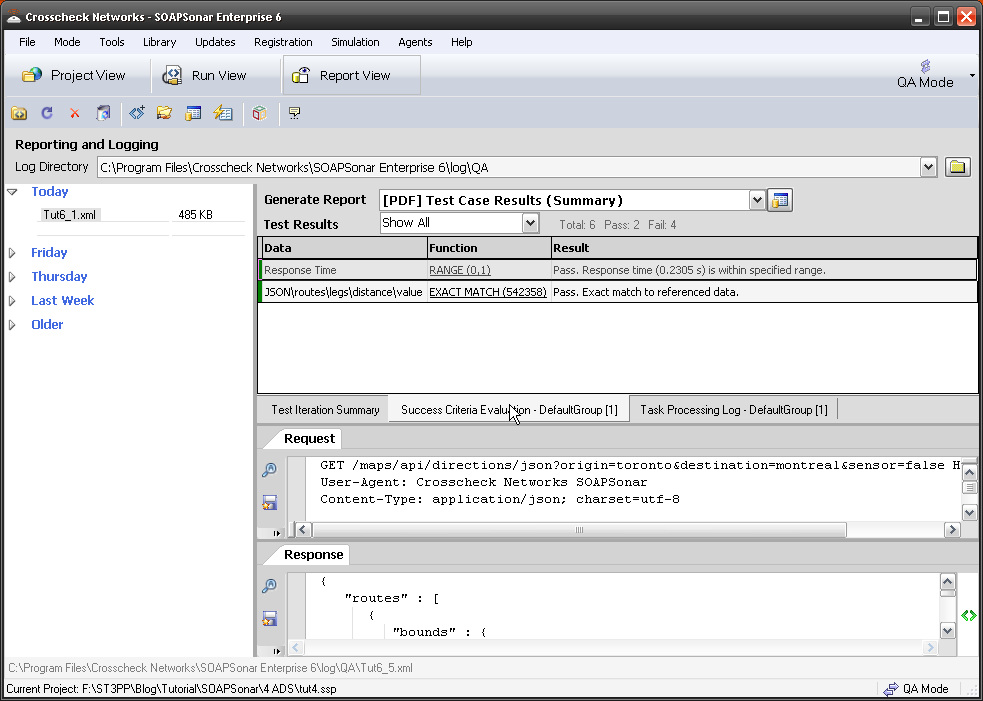
7. Select Success Criteria Evaluation, and you can see the Response time and exact Match rule we created, both were a success.

7 Success Criteria

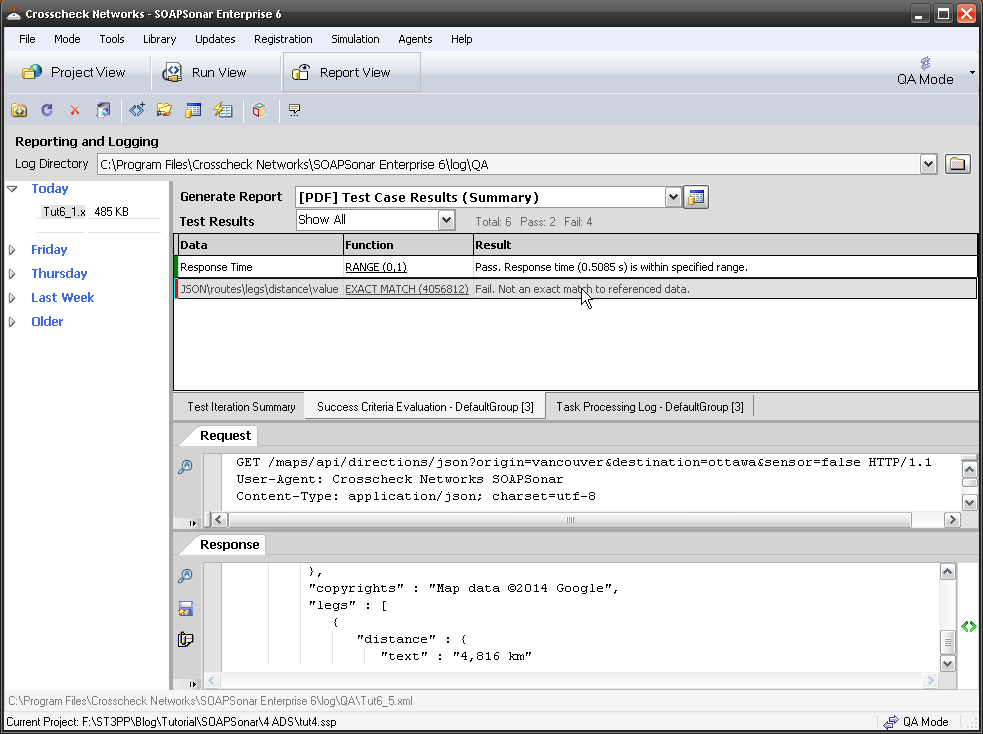
8. If select the 3rd line (first to fail) we see that it used the ADS Index  3rd row) the independent Response time and the response code was 200 (normally a pass). By selecting Success Criteria Evaluation tab, we can see that the exact match success criteria failed. That is, the csv value we were expecting was different from what we received.

8. first failed

9. We can generate a number of PDF reports via the drop down menu at the top of the page. These PDF reports can also be exported in a variety of formats. Take a look at a few.9 reports

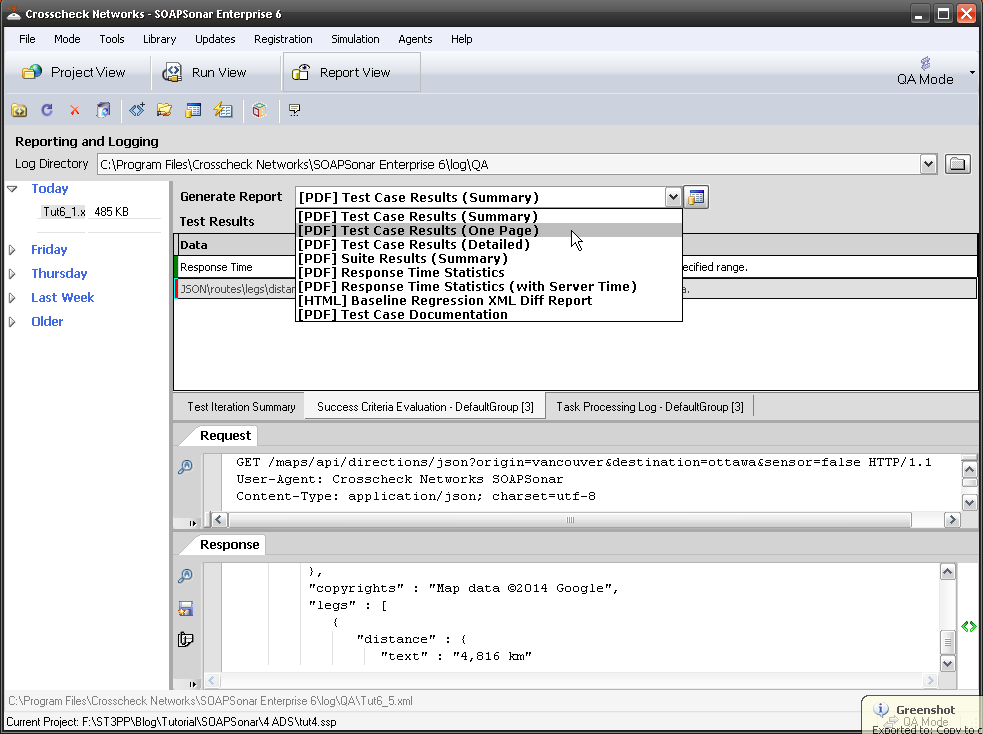
10. Running the same test in performance mode and not QA mode, generates an alternate set of reports. The same is true if its is against a baseline.

These results can also be published to HP Quality Center.

Conclusion

Between management level reports and detailed level request and responses, reporting can consume a lot of time. Testers tend to focus on how long it takes to run a manual test vs automate the test cycle, often forgetting about the time taken to generate reports in a manual testing environment and how long it takes to capture and supply the required information with any issues. The ability to supply the test case and log, is key to troubleshooting issues, and the first thing we ask our customers for when they have any technical support questions. That is because automation enables the exact repeat of the same test case, and therefore any issue should be simple to replicate.

Comments?


Performance and Load Testing

A second theme of interest that came up repeatedly at STAR Conference last week was Performance and Load testing. Many of those raising the question, had mobile applications or some form of mash-up or worked in Agile environments were performance and functionality were important.

In the SOA or API world, when I refer to Performance, I am referring to a single functional service request to response time taken. The performance of the service as part of the API or web service itself. In the below diagram, it would the time it leaves the client to the time a response is received. The additional API and Identity requests that happen behind the API 1, included. These I refer to as enablers. API 2 has a DB and its identity system, and API 3 is on a Enterprise Services Bus, and has multiple enablers on the bus. Each API may have a number of services associated with it, and each of these may require different enablers, or complete different functions, and so will have different performance characteristics. Granular performance information is therefore important for troubleshooting.

Load Testing, is the performance group of services at a given load. Modelled, using expected behaviour. If function 1 in API 1 is expected to be accessed 5 times that of function 1 of API 2, then the model needs to load Function 1 in API 1 5 x that of function 1 API 2. Load testing can either be throttled to evaluate performance times at a planned TPS or simply increased till errors start occurring, to understand maximum TPS possible.

User experience performance is the perceived performance via a given client. Here we add the performance of a given client to that of the network, API and enabler. User experience does not embrace device / client diversity. Caching, partial screen refreshes, and a variety client tweaks, may hide some perceived performance issues. That said, unless the API performance is know, a poorly performing client can be difficult to identify.

Performance

The most common performance issues that tend to come up, are problems not with the API themselves, but with the enablers. Some back-end database, identity system or ESB that may have some other process running on it at a given time (e.g. backup), has a network issue or requires tuning. Often these issues are due to changes in the environment or only at a given time. A single load or performance test run, a few days before final acceptance, often fails to identify these issues, or the issues occur in production at some later date.

I previously wrote a long multi-part series about performance troubleshooting in mobile API and I have no intent to repeat that. The constant surprise however, when I show a shared test case being used for functional and performance testing, is why  wanted to add some clarification. Usually I get a blank stare during a demo for a few minutes before a sudden understanding.  So many QA testers have being trained to think of different tools and teams for functional and load testing, that the concept of a integrated tool can be difficult to grasp at first, requiring some adjustment in thinking.

After the adjustment occurs, I consistently get the same 2 questions

  1. “Does that mean you can define performance as a function of success criteria?” Yes, each test case for each service in each API, can have a minimum or maximum response time configured in success criteria. Say you set that value as 1 second along with any other criteria for success. If at any time later on that test is run, including load testing, the test case will fail. There is no need  to create new test scripts, data sources, variables etc for load testing in a separate tool. If its a new team, just give them the test case to run.
  2. Does that mean you can do continual testing or regression testing, on production system and identify any changes in functionality AND performance at the same time?  Yes. If the value is set at 1 second response in success criteria, and  you configure a automated regression or functional test every hour/day/week/ whatever. If at any point, performance or functionality changes, the test case would now fail as the response would be different than expected or previously. There is no need to run 2 separate applications to continually test service for changes in functionality and performance.

At this point I usually point out the benefit of physically distributed load agents vs. just virtual users.  The ability to trigger a central test from multiple locations in your network and compare response times, allows not only the simulation of Server, but also the Network. Larger companies often break out network performance turning into another team, and don’t consider it an “application issue”. I believe any performance issues is functionally important. Smaller companies, and senior executives, are however quick to the benefits or consolidating this into a single tool and report.

Conclusion

Regardless of if your performance/load team is a separate group or part of your role, sharing a test case, and actually building performance in to the success criteria in the same tool can offer huge benefits in time savings and in identifying performance issues earlier in development cycle and during maintenance. Why not try it yourself? Here is a two tutorials on Load Testing and Geographically Distributed Load Testing.