Search for:

9. SOAPSonar – Performance

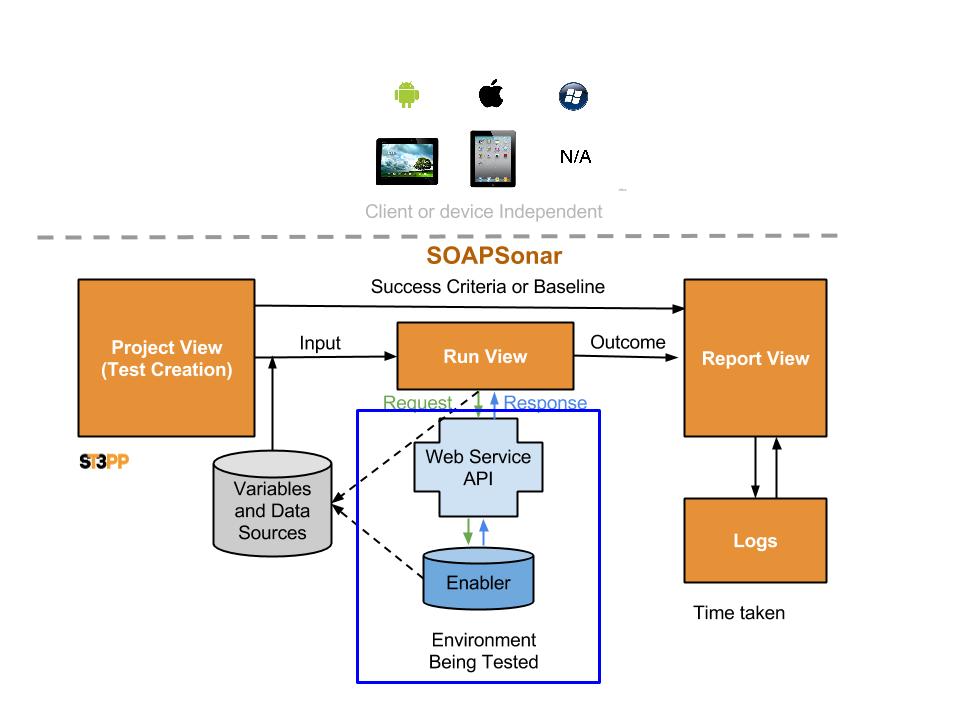
One of the benefits of SOAPSonar is that performance and load testing use the same automation tests developed for functional testing. You just need to switch the mode from QA to Performance on the top right. All data sources, Projects, Test Cases and Test Suites remain unchanged. This allows performance and load tests to be built into functional requirements and regression testing, without creating a new series of test cases in a separate tool.

In order to do performance and load testing, and prevent any accidental denial of service attack, we need to use a CloudPort runtime. Its free, it local and it integrates well with SOAPSonar. Its also a useful tool to have and one we will use for a number of future tutorials. So lets go ahead and download and install it.

1. Download and install the CloudPort Runtime Player. You have to accept export restrictions, but are not asked for no personal information.

2. Secondly, download the runtime, ST3PP performance and unzip it to a location you can find again. You should have 3 files. Tutorial v1 and v2 and a short csv. We use V2 in future tutorials.

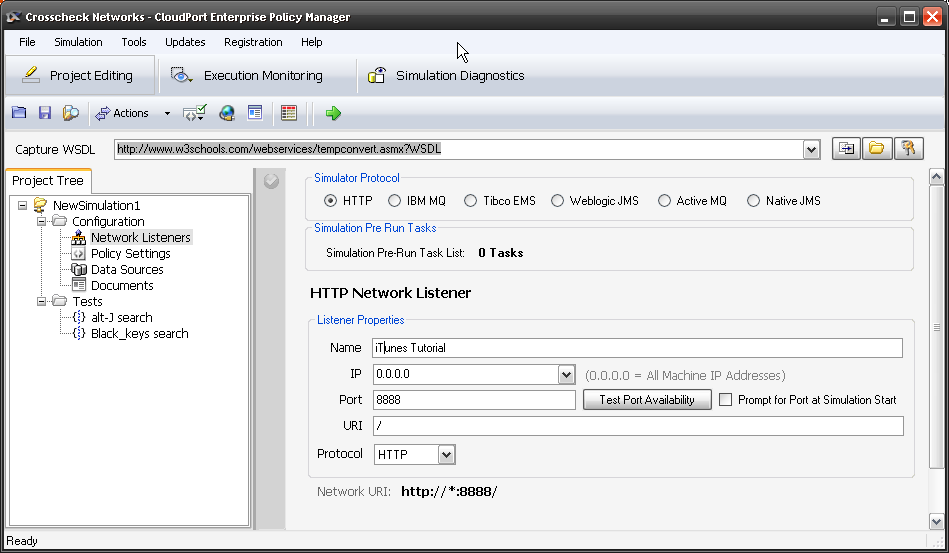
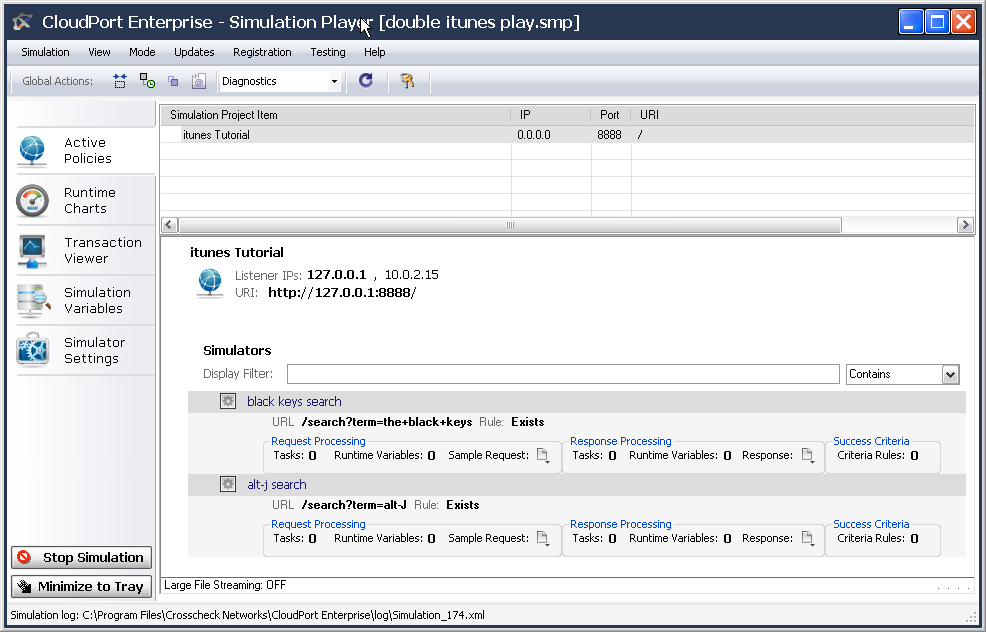
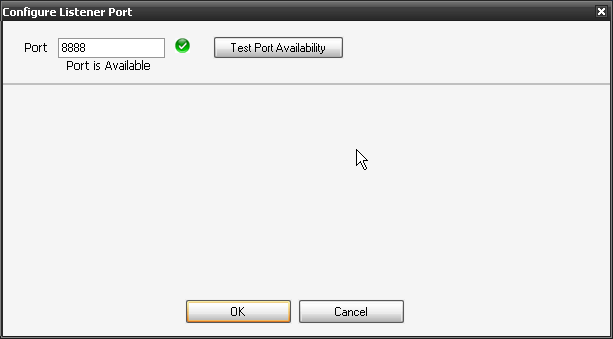
3. Launch the CloudPort Runtime Player and select run simulation, then find Tutorial v1 you downloaded and unzipped in step 2. Start Simulation Player. Accept port 8888. (good idea to Test availability)

3 run player

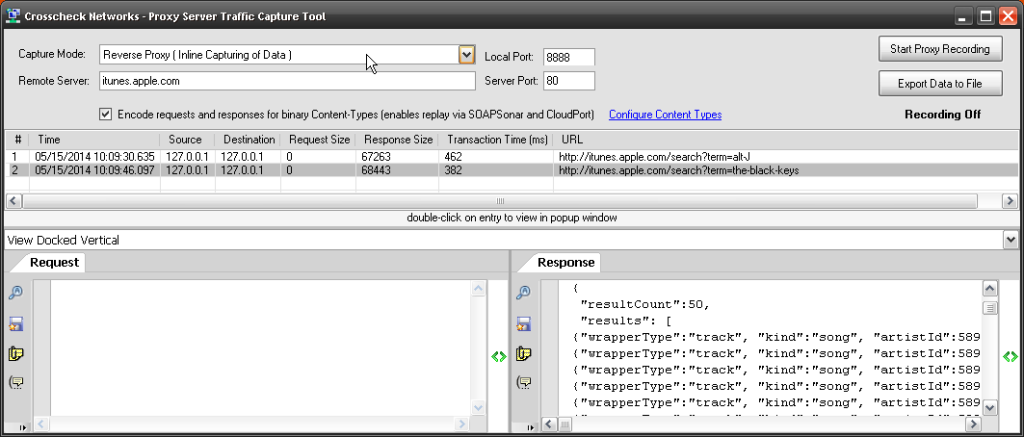
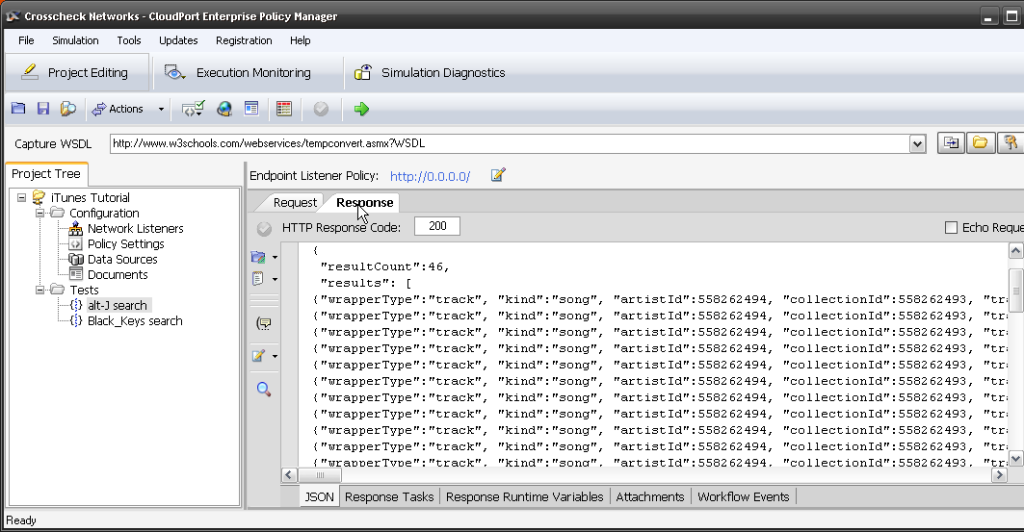
4. You now should have a JSON Simulation running on your machine to test against. If you look under Performance Test Tutorial, next to the icon of the networked globe,  you will see the URI should be http://127.0.0.1:8888/st3pp/ and the list of simulated services running, starting with soapsonar. Lets not change anything else here yet, but copy the URI http://127.0.0.1:8888/st3pp/.

4. Simulation

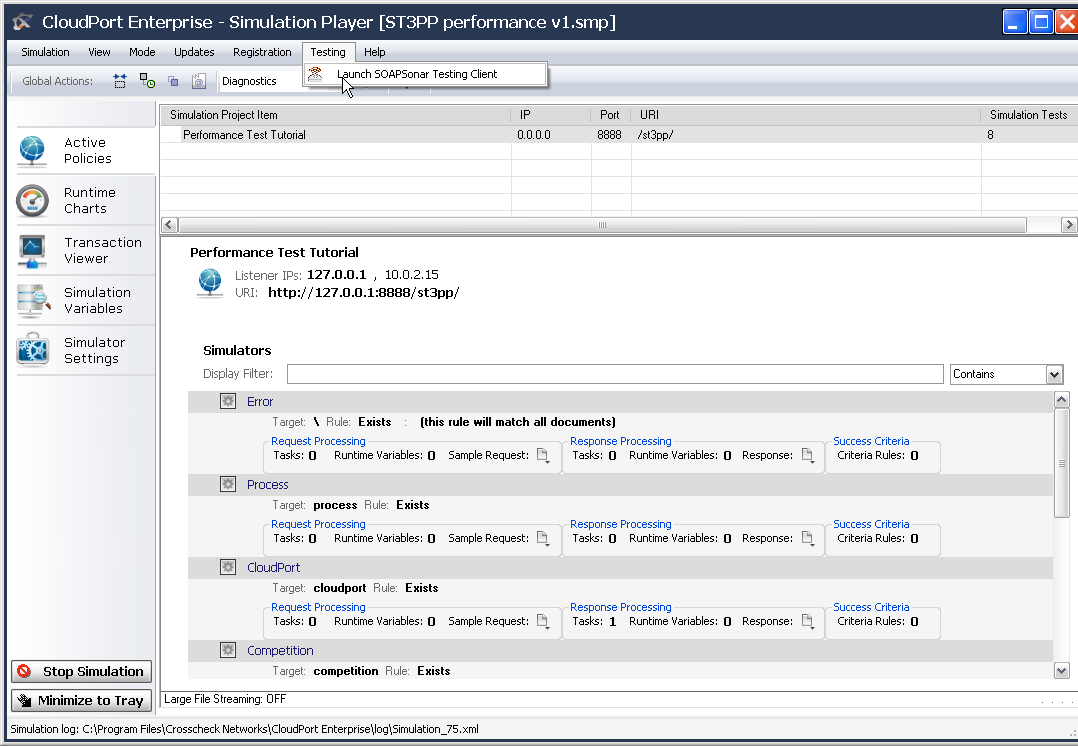
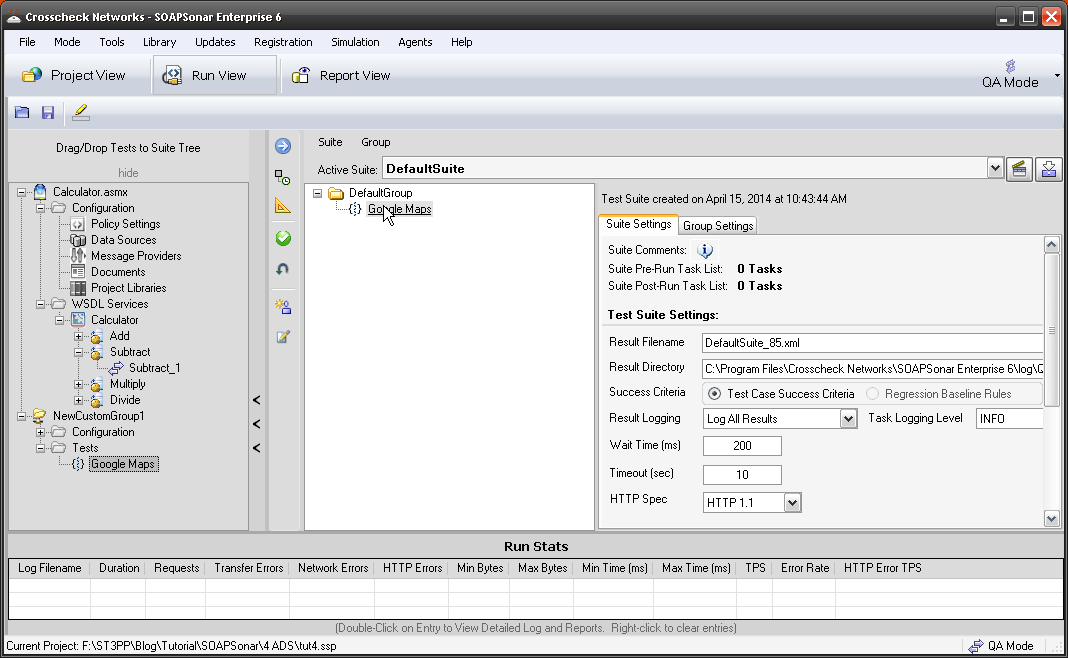
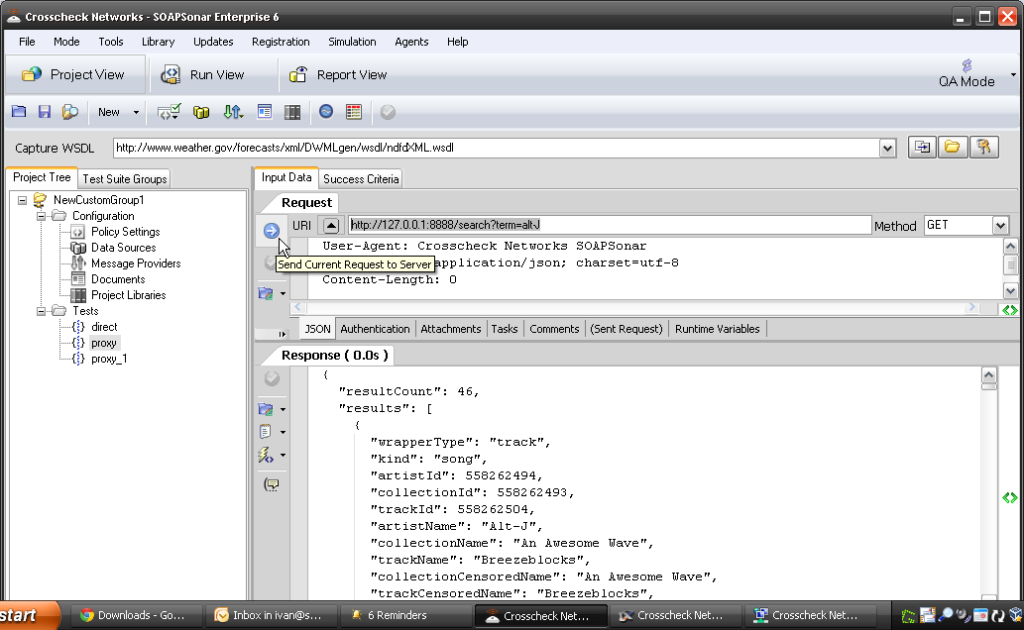
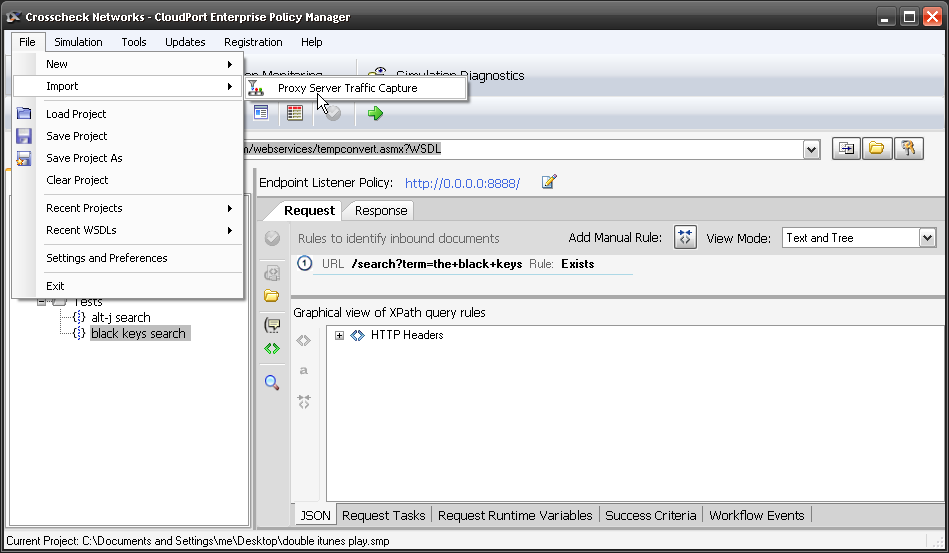
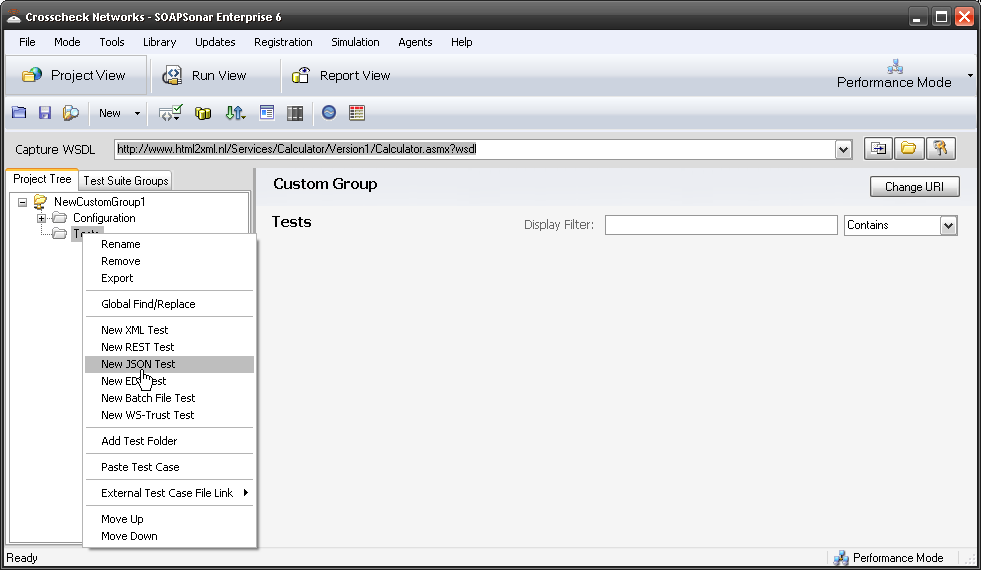
5. Leave the runtime running and launch SOAPSonar and lets create a basic JSON test case. You can do this by selecting Testing and then Launch SOAPSonar Testing Client from within CloudPort runtime or you can just run SOAPSonar as you usually do. Select File, New, Test Group then Right-click on Tests in the Project Tree and Select New JSON Test Give it a name like Performance

5. New Test

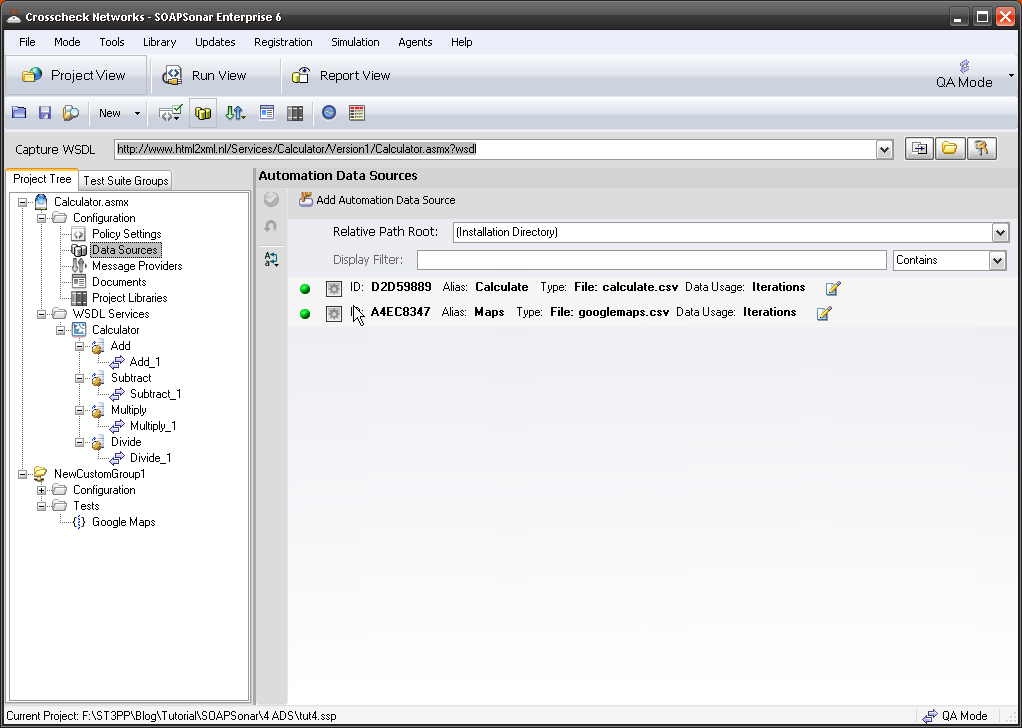
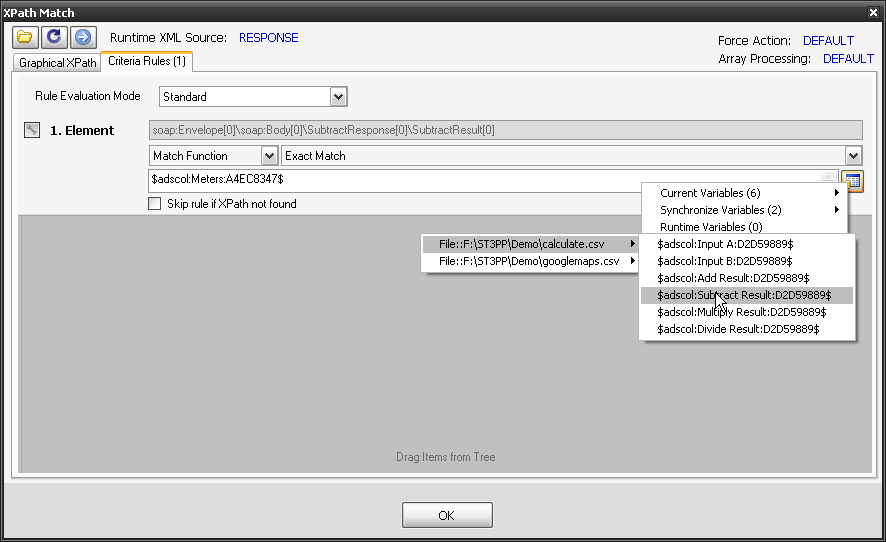
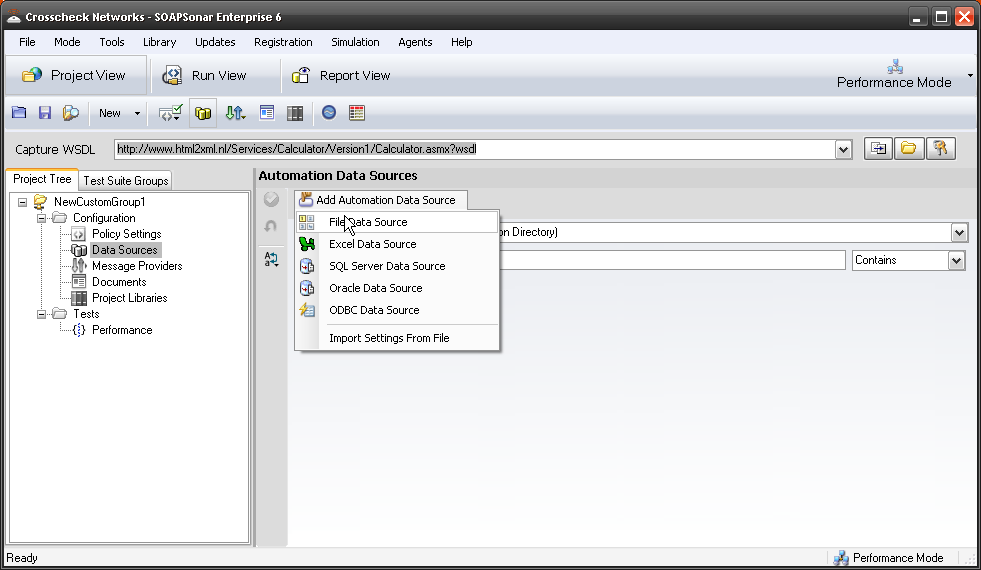
6. There is a small CSV file in the zip file you downloaded in step 2 called performance.csv. Lets add that as an [ADS]. In the project Tree under configuration, select Data Sources. Add Automation Data Source, then Select File Data Source. Give it an alias, find the performance.csv you extracted and ensure the Data Variables is on Request column, then select OK.

6 ADS

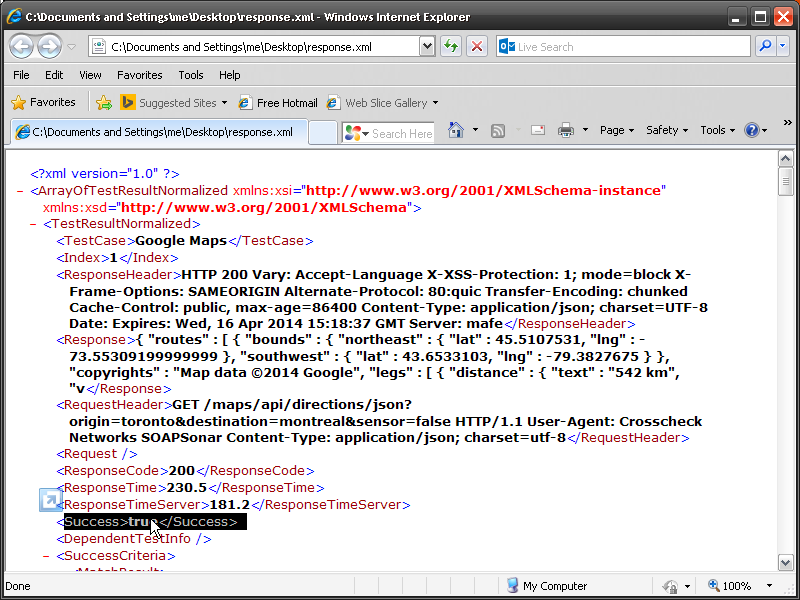
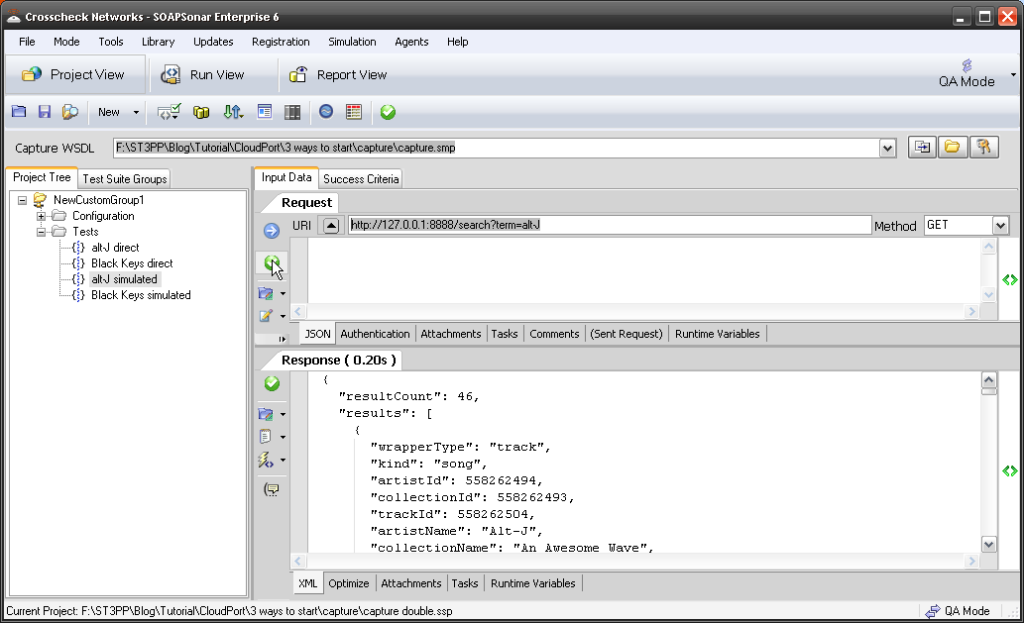
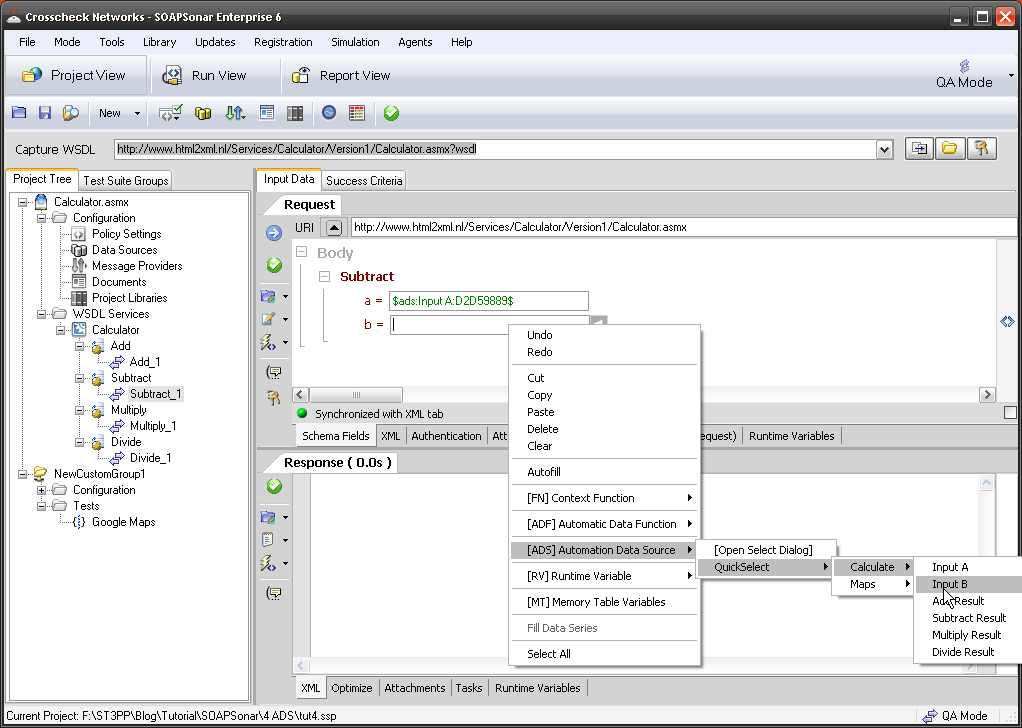
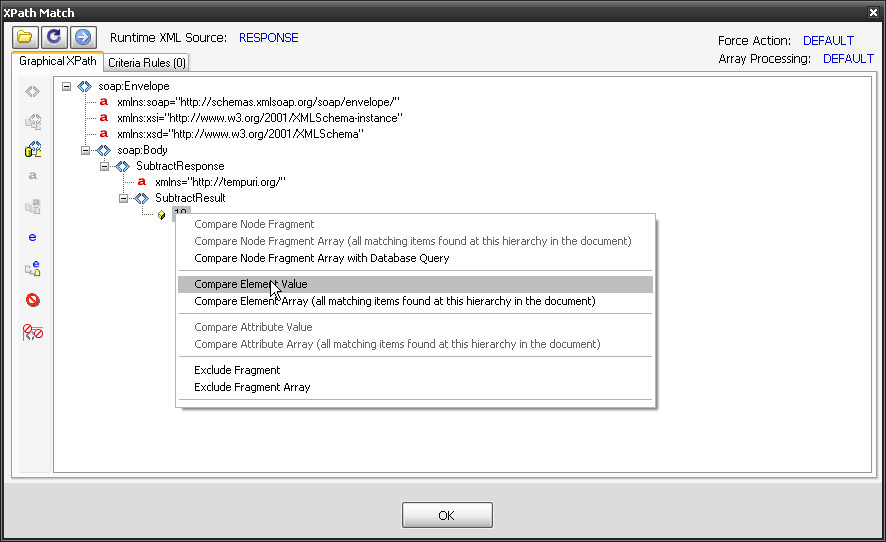
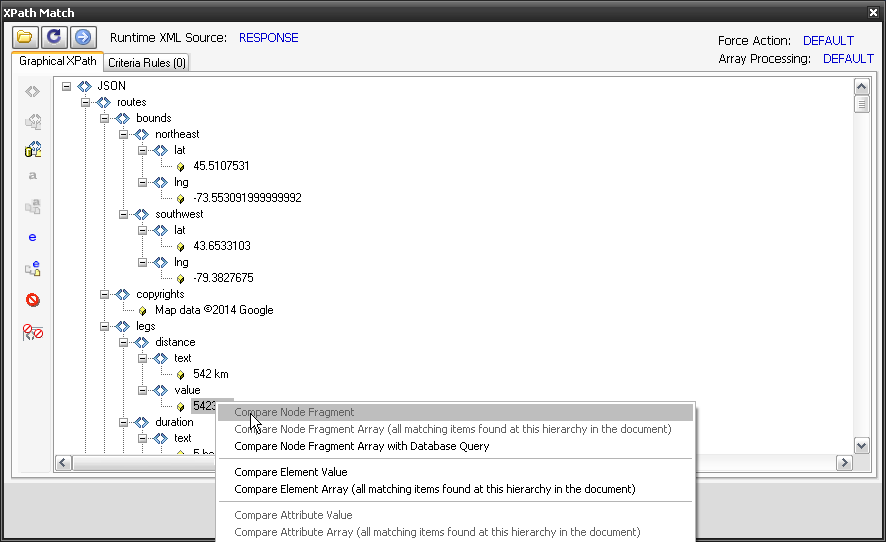
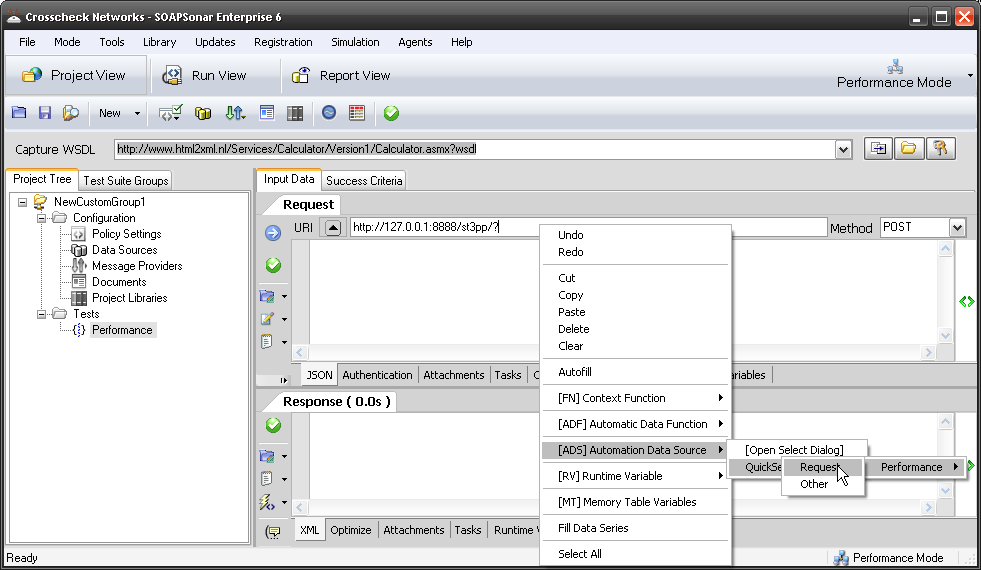
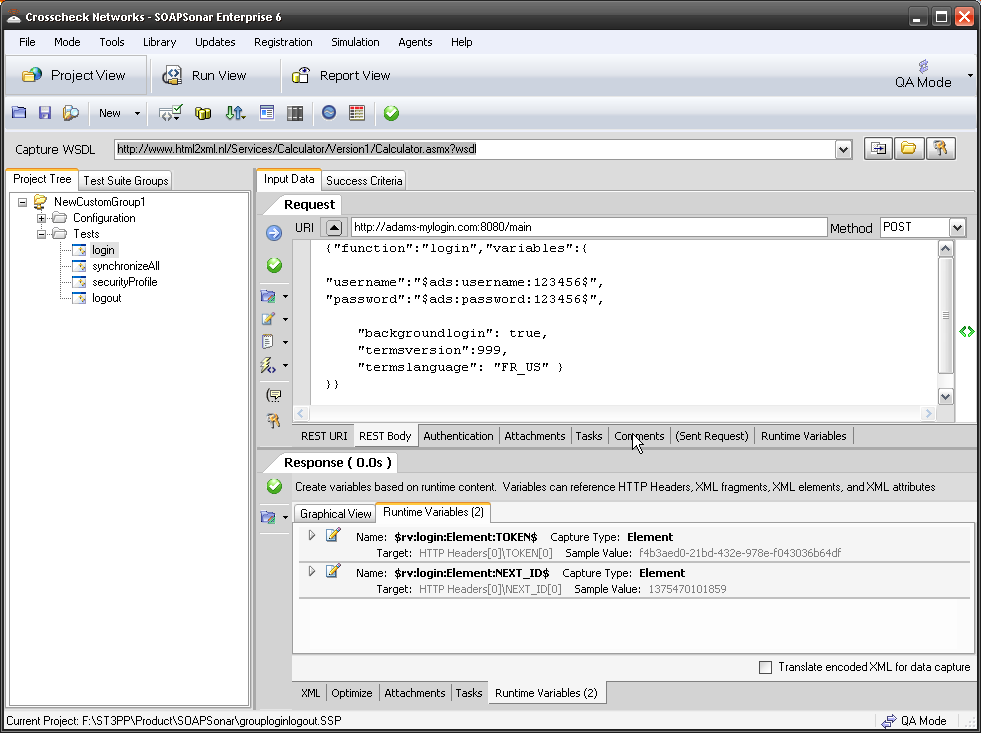
7. Back at our test case “performance“, paste the URI copied from CloudPort or http://127.0.0.1:8888/st3pp/ into the URI. Then add the query. In this case it will be ? followed by right-click and the [ADS] and our Request column. Set the method to GET (although it matters not in this runtime). Commit and Send Current Request to Server. Did you get a response that’s not a error? So far this has all being covered in earlier tutorials. your response should start with “Delivering”: “SOAPSonar”

7. Project

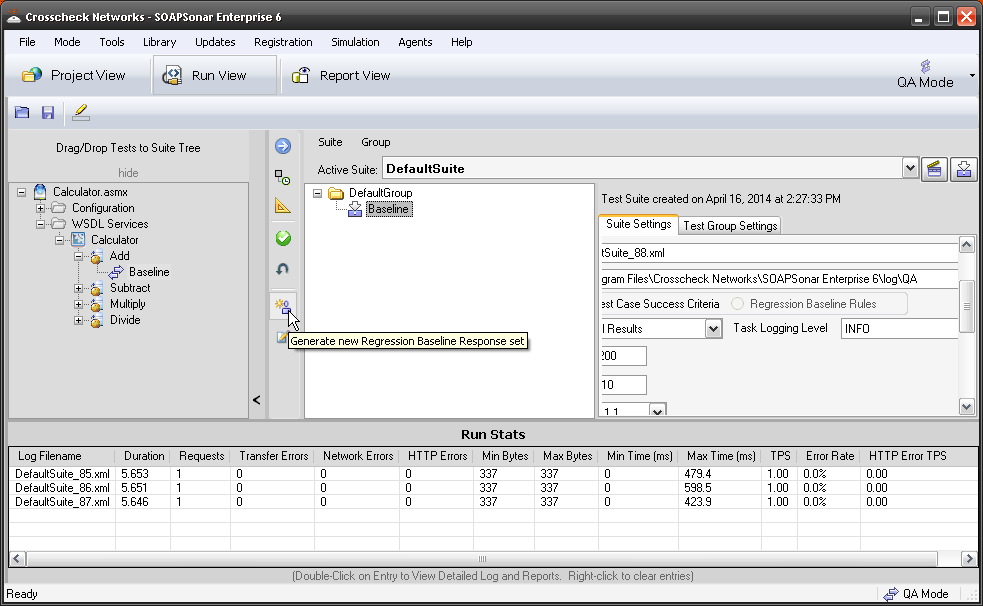
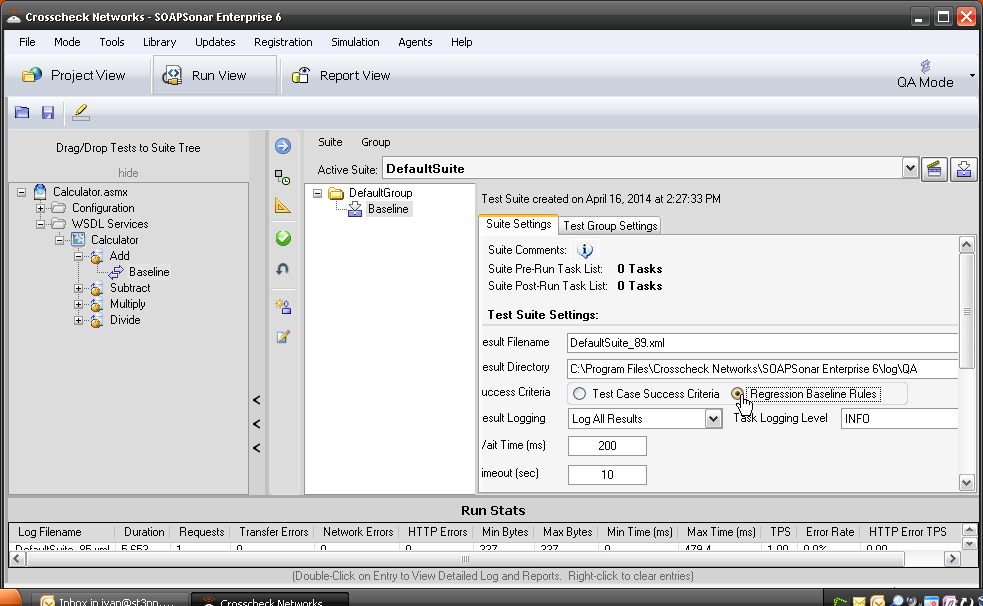
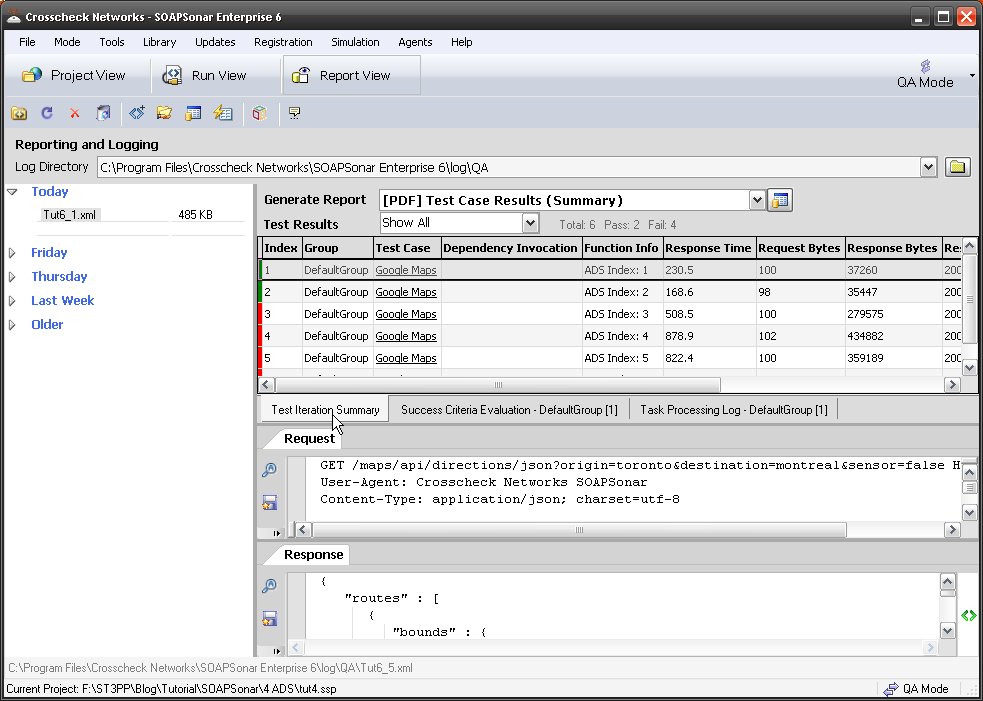
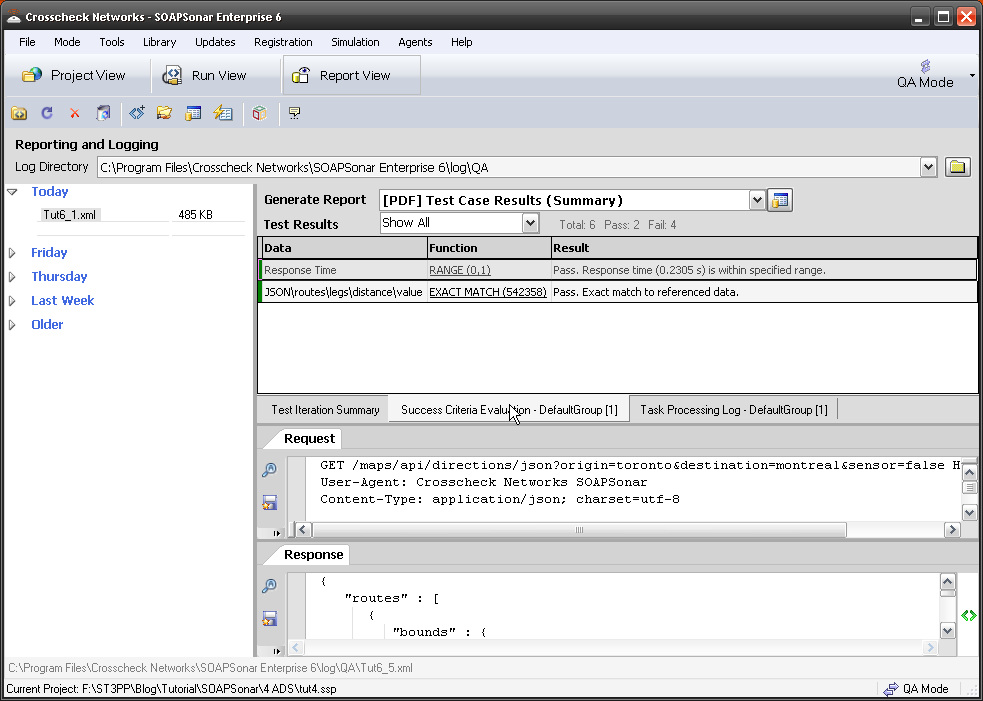
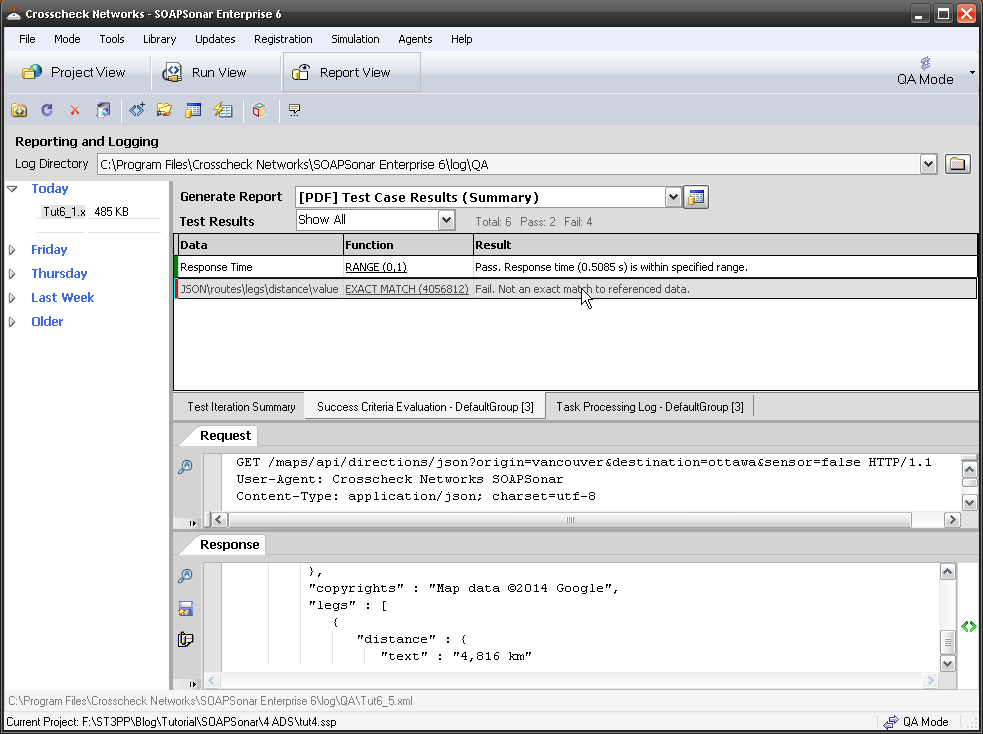
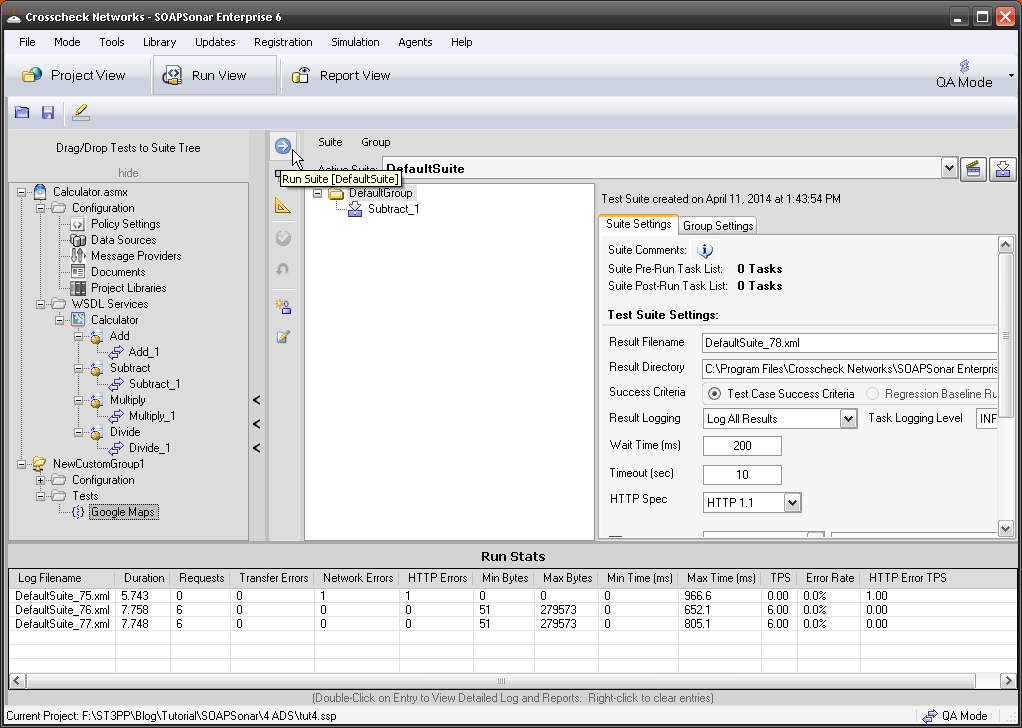
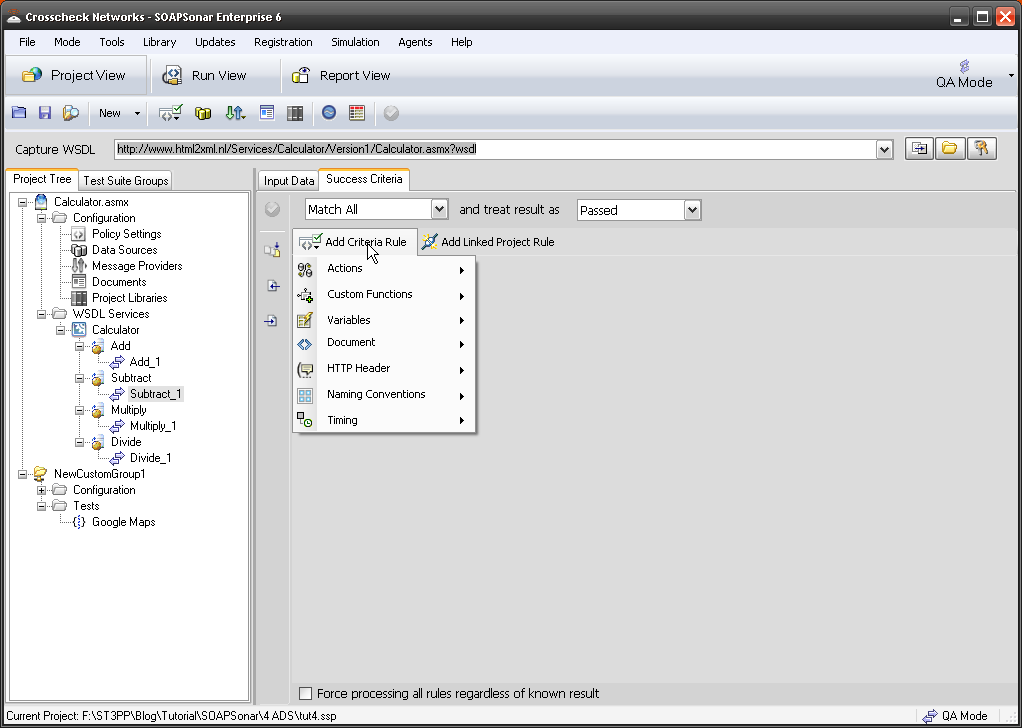
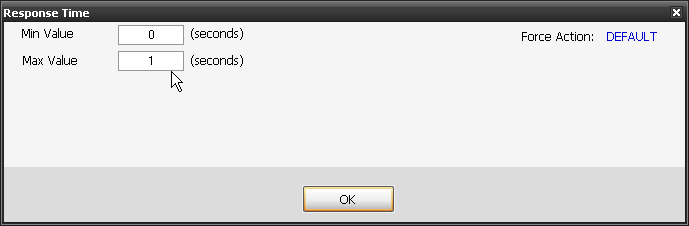
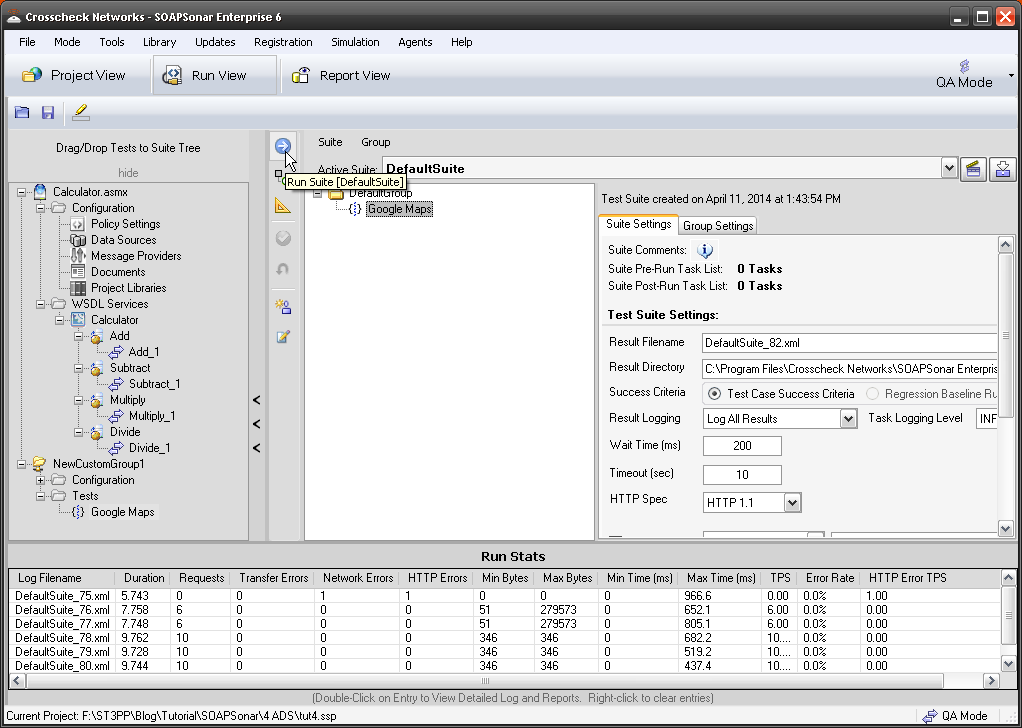
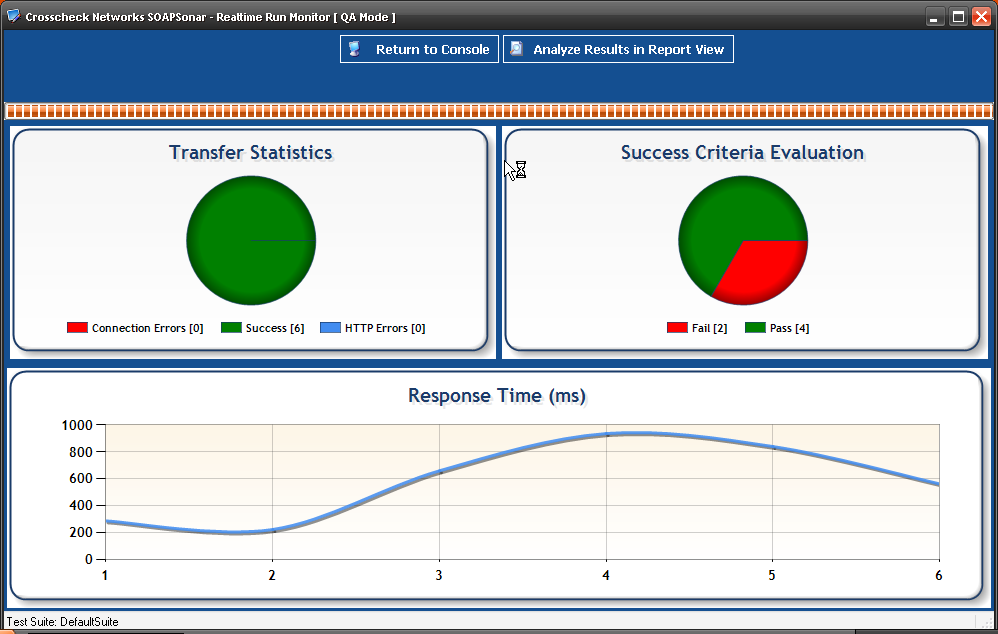
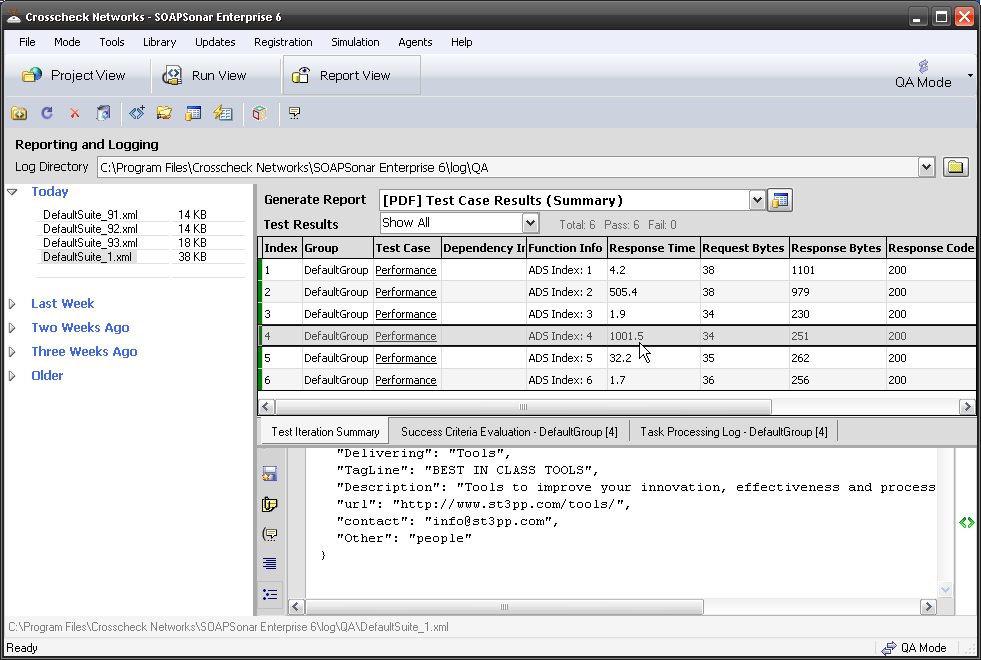
8. Select Run View and drag our test case over to the DefaultGroup. Check to make sure you right hand top corner is QA mode and Success Criteria is Test Case Success and not Regression. Then Commit and Run.  All 6 Test cases from the .csv should run and pass. Did they? Select Report View, and notice that 2nd Test case CloudPort took over 500ms and the 4th test case Tools, took over 1000ms. This is because the runtime has some latency added for these two cases. These individual services, not under load perform slower.  So far you have being testing functional testing. If we wanted to we could add a success criteria now and fail any service over a certain response time, now would be a good time.

8 Slow

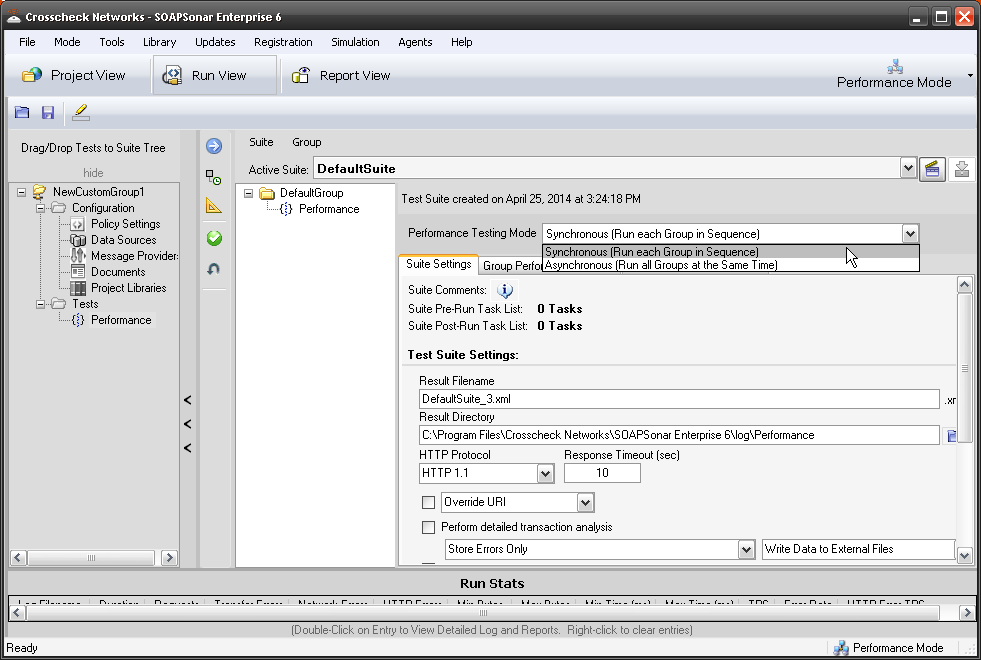
9. lets go back to Run View and Change SOAPSonar from QA Mode to Performance Mode in the right top corner.  Notice that Suite Settings Changed? Now if we select Run Performance Testing in Synchronous Mode, each test group is run sequentially and each test case performance statistics are isolated and run individually. Asynchronous will run all your test groups at the same time to replicate different traffic patterns. We only have one test in one group. So lets leave it on Synchronous. Lets also leave the rest for now. Careful with logging as it can effect your machines load and hence performance.

9 Synchronous

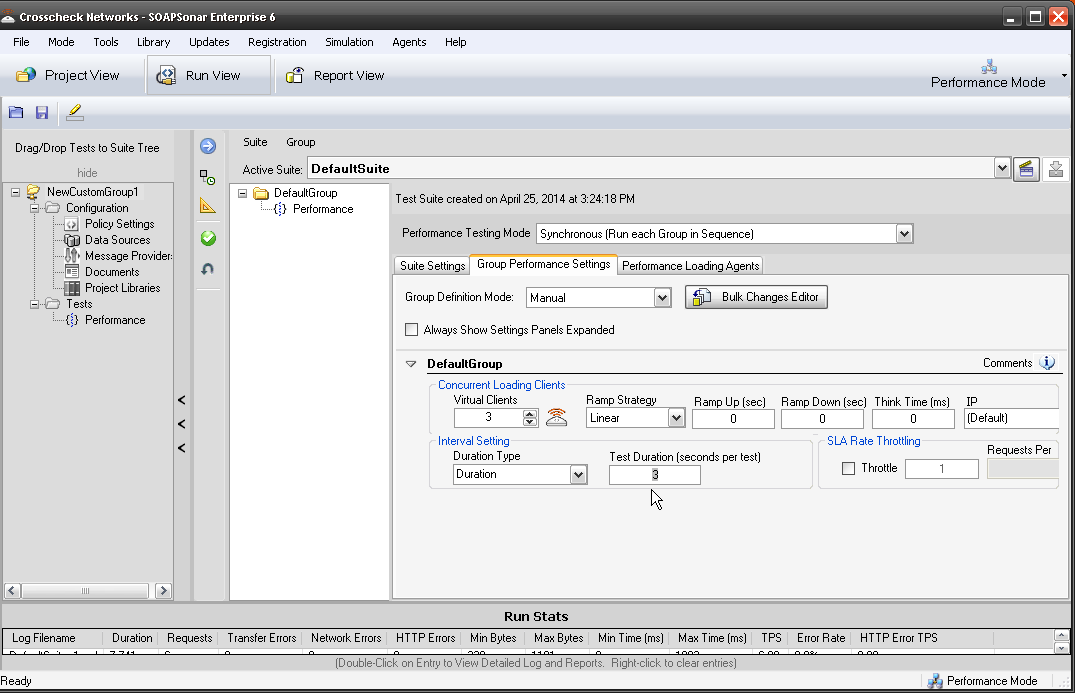
10. Select the next Tab, Group Performance Settings. Here we establish the number of Virtual Clients and the length and extent of the load. Select just 3 virtual clients and set it to Duration and 3 seconds. Leave Throttle unchecked as we see how many TPS we can hit with 3 Virtual Clients. We have made no changes to the [ADS], functional test, regression or success criteria. Commit and Send.

2014-010 Virtual

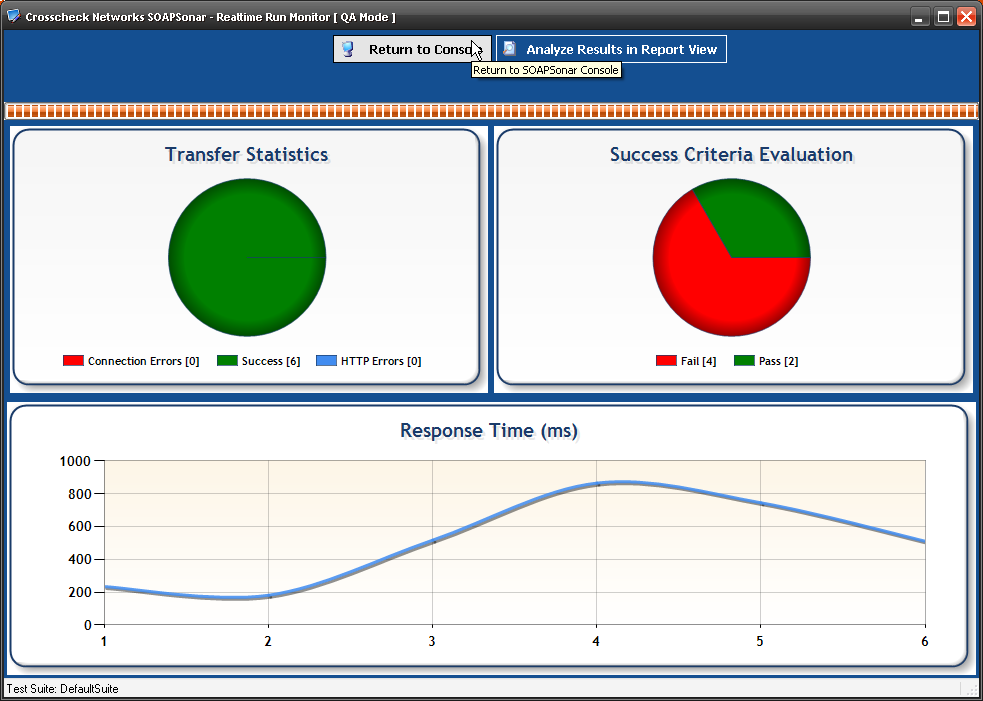
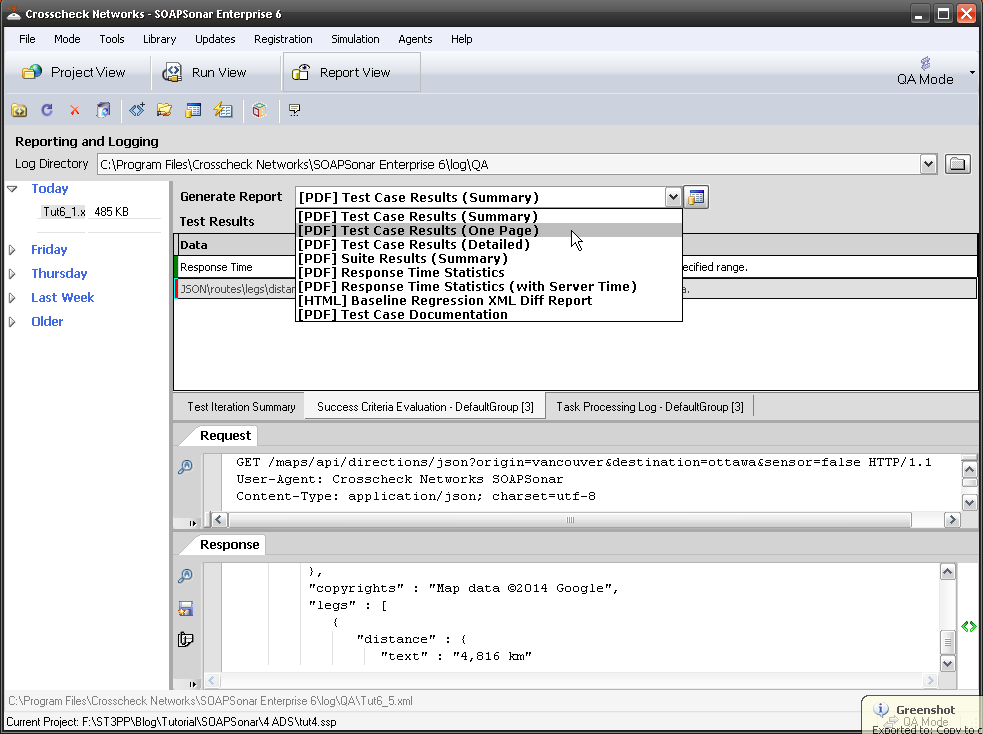
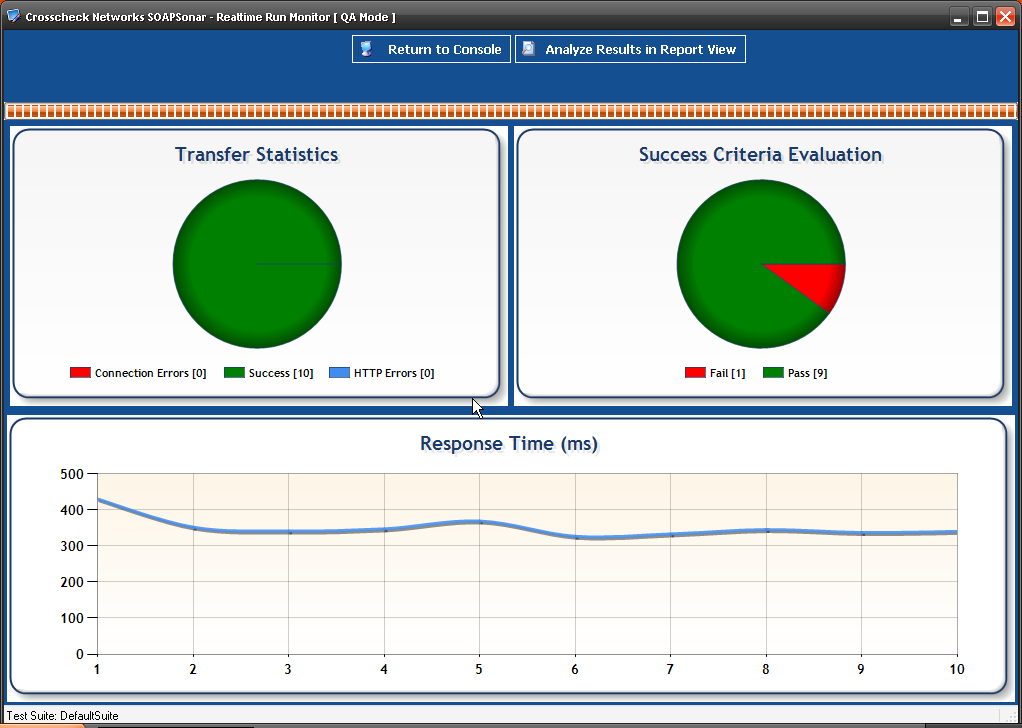
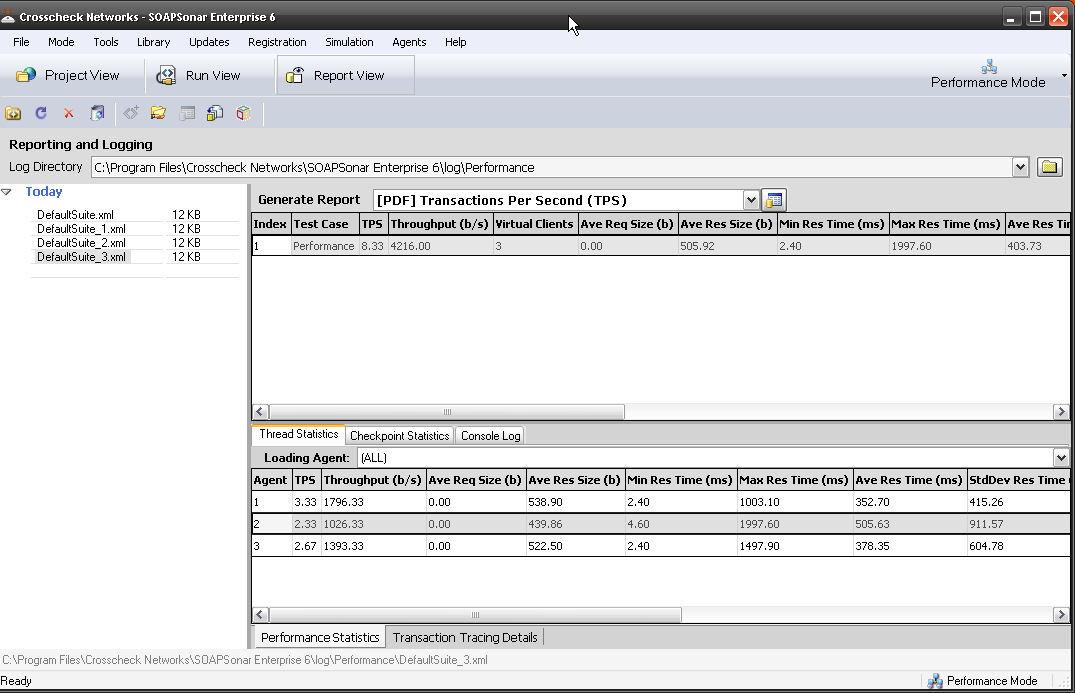
11. This time your Realtime monitor is different. In report view, you see a consolidated report, when you select that, you see a break down per virtual client. East virtual client can export a file for further processing or you can generate a report. How  many TPS did you hit? We highly recommend using the 90% Res Time column as a reference, ignoring the 10% of responses that are extra long or short.

11 Report

Conclusion.

Doing load and performance testing as early in the development cycle can be critical in finding the time to address any concerns. Using the same test case and simply switching to performance mode vs developing a new set of test cases in a different tool, enables far greater coverage and reduced time.

In our next tutorial we will use both virtual and physically distributed load agents in a performance and load test.

Take a minute to give me some private feedback in the form below. This will be mailed to me and not published.

[contact-form subject=’Performance Testing’][contact-field label=’Handel’ type=’name’ required=’1’/][contact-field label=’My opinion on Perfromance and Load testing is :’ type=’radio’ options=’Why would anyone do Performance or Load tesing?,We do Performance but not Load testing,We use different tools for Performance and Load testing,We use an integrated Tool for Performance and Load Testing’/][contact-field label=’We do performance testing as part of Coninous and Regression Testing’ type=’checkbox’/][contact-field label=’Comment’ type=’textarea’ required=’1’/][/contact-form]

Otherwise please post any public comments below.

8. SOAPSonar – Identity and Authorization

Many of our customers start their development or testing using some other product, then reach a point where they need to use some form of identification, cookie, key, encryption or other form of authorization and realize the tool they using does not support what they need. They then look at the months work completed vs starting with a new tool.

There are simply so many ways, standards and architectures for identity, that most tools are unable to support more than a few. Before selecting an automation tool, I highly recommend taking the time to identify and test all the applicable identity and authorization needs you may have. Although this is a “tutorial” I am not going to cover off all possible options, or full detail on a single option. Rather, I will try and explain some of the more common options and were to find these settings.

In this first example I want to show the testing of a login service. In this (REST) example a POST request is made to a given URI and the message body contains the username and password variables. Once successfully logged in, the service responds with a Token and ID, that are used further in the application. These username and password variables can be tested via an automation data source (.csv) and each step of the login process chained, by creating a runtime variable of the token response. The benefit is then the ability to load test this login service using this [ADS].

1 Message body
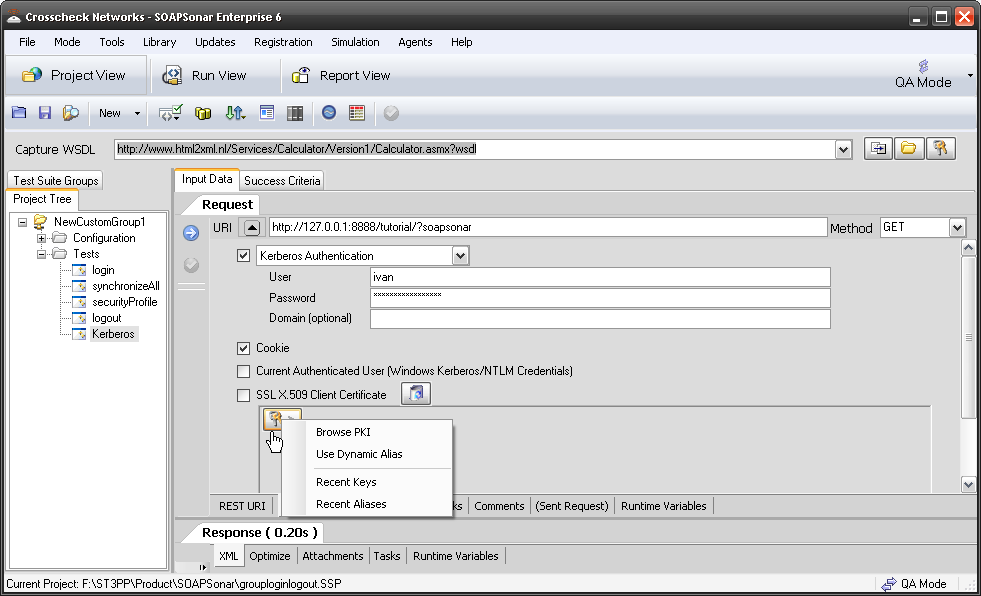
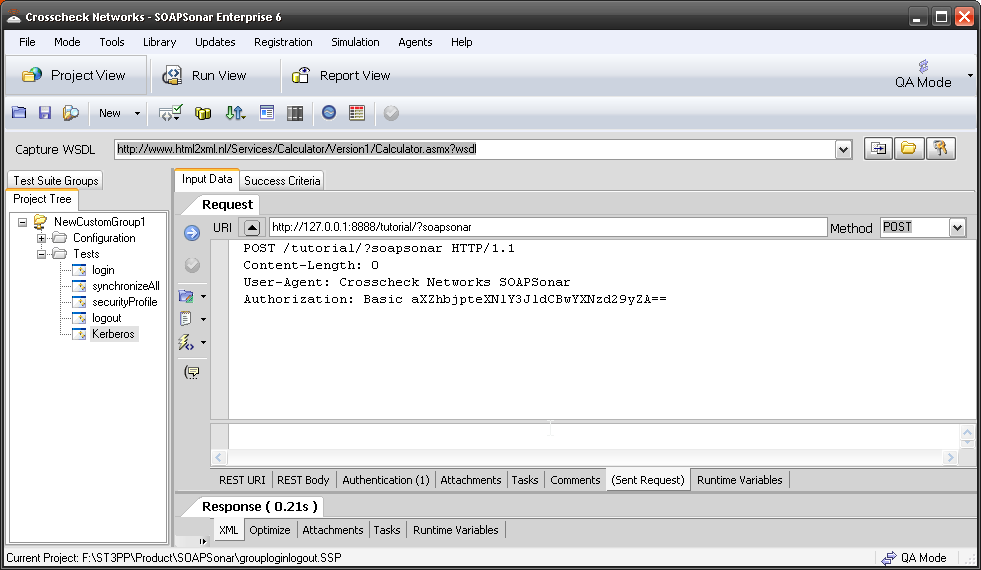
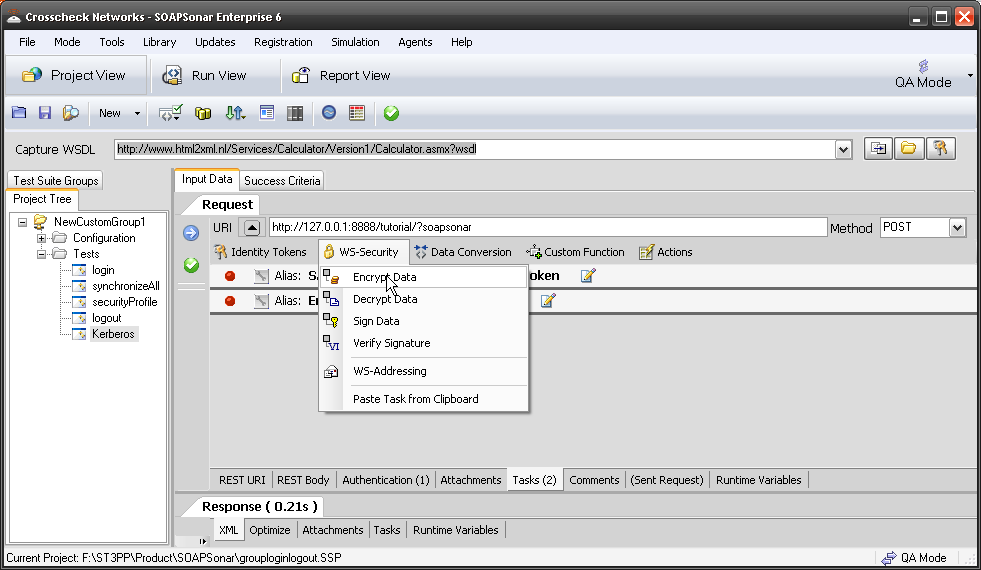
Sometimes identity needs to be in the header. In the request section of SOAPSonar, at the bottom is a number of tabs.  By either clicking on the keys icon or the Authentication tab, can see a number of options for configuration. Here you can find Basic, Kerberos, or Digest Authentication settings. You can also set up using the returned cookies and SSL certificates to send embed as part of the header message. (a reminder at the bottom says For WSS-Token SOAP Header Authentication, use the Tasks tab). In the screen below, I selected Basic and entered my username and password.

2 Encryption

When I look at the message header request I sent, I can see the line Authorization: Basic aXZhbjpteXNlY3JldCBwYXNzd29yZA== added to the header request sent.

3 Request

In the Task tab, is a number of Token and WS-Security Functions. Looking first at Identity Tokens, you can select from a wide variety supported.

4. Tasks

I selected SAML 2.0 Token, popular with today’s mobile applications. Once added, you can configure the token by selecting the spanner icon next to it and activate it by ensuring it shows a green dot.  Here is a screenshot of just the first tab for SAML token configuration. As you can see the options need to be extensive.

5. Options

A second group of tasks is the WS-Security tasks. Here you can encrypt and decrypt the message with various keys and options. This enables testing of HTTPS and other secure services using the same test cases developed for functional testing.

6. Token

Once added, you again configure it by selecting the spanner icon and activate/deactivate it by enabling a green dot.

7 PKI

The same WS-Security settings are available in the response section, to encrypt or decrypt the response.

8 response

Conclusion

Integrating identity, authorization and encryption into your automation test case is essential if you wish to do any kind of continual testing or regression testing. Especially using your test cases after release, were without these features, your test cases developed would be not work in a production environment.

This tutorial did not show a real examples, but I wanted to highlight were to go and what are some of the options for testing authentication, identity and encryption, without blacking out my secret keys, to look like some 3 or 4 letter government censorship organization got to the pictures first. I hope you find it useful in getting started. Comments?

7. SOAPSonar – Baseline and Regression Testing

We all have had experiences were “someone” decided to make a slight “tweak” to some code then promptly forgot to mention it to anyone else or at least the right someone else. That slight tweak causing some change, be it expected or not, that causes other parties to spend hours trying to trace the cause.

One of the key benefits of automation is the ability to identify any changes to XML by doing a XML diff. Comparing one version (Baseline) to that of another, (Regression Test). With web services API, we interested in the Request and Responses to ensure that they are not different, or rather that only expected differences are there. We need the flexibility to ensure that a some of the parameters be ignored, when they expected to be different each time.  Take for instance a file reference number or a service that returns the time. We may want to check to make sure the fields for Hour, Minute, Day, Month, Year etc remain unchanged, but perhaps we wish to accept changes to values in the fields, or limit these to certain parameters. Establishing what to check against the baseline and what not to, is an important part of regression testing.

Here is a Very Simple Baseline and regression test, using the SOAP Calculate Service.

1. Run SOAPSonar (with Admin Rights). Paste

http://www.html2xml.nl/Services/Calculator/Version1/Calculator.asmx?wsdl

into the Capture WSDL bar. Select Capture WSDL.

2. Lets use the Add Service. Select Add_1 and enter a=3 and b=3. Commit, Send. Hopefully your response was 6. If not, perhaps I could suggest some services? Rename it baseline.

2 Project View

3. Now lets select Run View, Drag Baseline into the DefaultGroup. Now select the Icon Generate New Regression Baseline Response Set.

3 Generate

4. Select XML Diff of Entire Baseline Response Document. This option matches both nodes and values.. Select OK, (Commit and Send if you need to)

4 XML diff

5. After the test is run, you will see the Test Suite Regression Baseline Editor. This is were you can select what you wish to watch or ignore. Automatically a base rule is generated. If you select Index 1, you should have 1 rule XPath Match. If you select XPath Match, you should see all the nodes graphically laid out for you. At the bottom you have 3 tabs. Baseline Criteria, Baseline Request (Captured Request), Baseline Response (Captured Response). For now, lets not change anything and just select OK.
5 Baseline editor

6. Lets go back to Project View, and change our b= to 9. The response should now be 12. Commit and send to Check. Then select Run View and change the Success Criteria to Regression Baseline Rules (See cursor). Commit and Send. This time, did your Success Criteria Evaluation Fail? It should, as it was expecting 6 as a response and not 12. Analyse Results in Report View.

6. Run baseline

7. If you now select that failed test case and then select the tab Success Criteria Evaluation, you see that Regression Baseline XML Node and Value Match failed, and it was the AddResult value.

7. Failed

8. Select Generate Report, then [HTML] Baseline Regression XML Diff Report and generate the report. Then View the report. Select Response Diff for Index 1. 1 Change found and you can clearly see it marked in Red.

8 report

9. Now lets ignore the response value, but maintain regression for the rest of the test case. Select Run View, then Edit Current Baseline Settings.

10 ignore

10. You should be back in the Test Suite Regression Baseline Editor. Select Index 1, then your rule and right click on AddResult in the visual tree. Select Exclude Fragment Array. It should show now in Red as excluded. Ok, Commit and Send. Your Regression Test should now pass, as everything but that value is still the same.

9 change

Conclusion

Automation of Regression Testing is far more than running an XML Diff. It involves selecting what aspects are expected to change and what aspects are not. By eliminating expected changes, any failures in future regression tests can receive the focus they deserve. Once automated, this can be run, hourly, daily, weekly or as needed, consuming little to know human interaction. Many of our customers, maintain a baseline and consistent regression test on 3rd party code. Any service their systems rely on, which they are not personally aware of development cycle. Continually testing through automated process to ensure they aware of any changes to the code.

Questions, Thoughts?

6. SOAPSonar – Report View

An important reason for Automation, can be the time saved over generating manual reports. Comparing expected results with actual on a case by case basis and sorting through this date to combine it in a meaningful way. Making sense from pages for XML, in an attempt to filter the few key issues. One of the top 5 issues shared with me is false positives, or QA reporting an issue, that was either incorrectly diagnosed or not considered a issue. Much of this can be mistake in what was entered, but just as often, a mistake in understanding the expected behaviour.

SOAPSonar Test Cycle

So lets take a look at SOAPSonar’s report view, carrying on from the previous Tutorial #5 defining success criteria.

1. Lets start this time with JSON Google maps. In QA Mode, Project View. Please confirm you have the service and the [ADS] and that service works. Switch to Run-View and clear any tests under the DefaultGroup and drag over only the Google Maps test case we did in Tutorial 5.

1 Starting out

2. look at the area to the right, In QA Mode there are 2 tabs. Suite Settings, and Group Settings. If you switch to Performance mode, there are 3 different tabs. In QA mode, lets change the Result File name to Tut6_1.xml and leave the location at C:\Program Files\Crosscheck Networks\SOAPSonar Enterprise 6\log\QA. We have not captured a baseline for regression testing, so select Test Case Success Criteria. Result Logging as Log All results and Verbose and Use Optimized XML logging. Warning, Logging all and verbose logs in large test environments can greatly effect performance and seriously load any workstation. We usually recommend log errors fails and errors. HP Quality Centre and other options, leave unselected.

2. Verbose

3. On the Group Settings tab, lets leave things default. Here you can define a Data Source table to run through multiple tests. Commit and Run Suite.

4. Realtime Run Monitor shows that I ran 6 test cases of which 4 failed and 2 passed. Select Analyse Results in Report View at the top of the page.

4. Realtime

5. In Report View, we can now see on the far left, under Today, I have Tut6_1xml Log file at the location we entered in step 2. Right Clicking on the file allows you to export Request and Response Data as Files and Export Results to Normalized XML. Select Export results in Normalized XML and you have details of each test case run.

5 Log files

6. In the main section you can see the first 2 tests are green and the rest red. Selecting the first test, and the tab Test Iteration Summary and the Request Response Tabs populate with the what was sent and received. Do you notice the exact time for and size of each message is also reported along with teh response code?

6 First Test

7. Select Success Criteria Evaluation, and you can see the Response time and exact Match rule we created, both were a success.

7 Success Criteria

8. If select the 3rd line (first to fail) we see that it used the ADS Index  3rd row) the independent Response time and the response code was 200 (normally a pass). By selecting Success Criteria Evaluation tab, we can see that the exact match success criteria failed. That is, the csv value we were expecting was different from what we received.

8. first failed

9. We can generate a number of PDF reports via the drop down menu at the top of the page. These PDF reports can also be exported in a variety of formats. Take a look at a few.9 reports

10. Running the same test in performance mode and not QA mode, generates an alternate set of reports. The same is true if its is against a baseline.

These results can also be published to HP Quality Center.

Conclusion

Between management level reports and detailed level request and responses, reporting can consume a lot of time. Testers tend to focus on how long it takes to run a manual test vs automate the test cycle, often forgetting about the time taken to generate reports in a manual testing environment and how long it takes to capture and supply the required information with any issues. The ability to supply the test case and log, is key to troubleshooting issues, and the first thing we ask our customers for when they have any technical support questions. That is because automation enables the exact repeat of the same test case, and therefore any issue should be simple to replicate.

Comments?


3 Ways to Get Started with CloudPort – Capture

This is part of a 3 part series on creating simulated services. CloudPort comes with a proxy capture tool to Capture and then replay a simulated version of the service that currently exists. A simulated, response will remain static, and not effect data integrity of the enablers, but can be load or otherwise used for testing. Workflow and tasks allow for some additional intelligence, but we keep this about getting started.

Lets use iTunes RESTful JSON service. Since I have this song in my head, and the documentation for how to use this service is available. As you will see, the response can be quiet lengthy.

1. Lets test the actual service first. Open SOAPSonar, and File, New Test Group, right-click, New JSON Test Case, and rename it Direct. Paste

http://itunes.apple.com/search?term=alt-J

into the URI and method as GET. Commit and send.

1 direct

2. Now in CloudPort, select Tools from the menus bar, then Proxy Server Traffic Capture Tool.  Make the local port 8888 (easy for me to remember) and then paste itunes.apple.com into the remote server and Start Proxy Recording. You now capturing all requests made to your local machine on port 8888, which is then forwarded to itunes.apple.com.

2 Proxy

3. In SOAPSonar now, lets send the request to be captured. Clone Direct test case and rename it Proxy. Now change the URI from itunes.apple.com to 127.0.0.1:8888 which is your local machine running CloudPort on port 8888.  The entire query will look like

http://127.0.0.1:8888/search?term=alt-J.

Commit and send.

3 Capture

4. You can send as many queries to that domain to capture as you need to match with your test cases you will run. Lets add a second. Clone proxy and change the URI to  

http://127.0.0.1:8888/search?term=the+black+keys.

Commit and send.

7 Rename

5. You can see the request (header) and the response in the capture tool. Stop the Proxy and Export Data to File. Give it a name you remember and save it. The close the Proxy tool.

5 export

6. Now we need to import the captured file. File, Import, Proxy Server Traffic Capture. We know its JSON, so lets select that vs. leave as auto detect. Either should work, although some services dont always adhere to all standards. Find your captured file. When you import, CloudPort asks if you would like to keep response timing. If you say yes, the new simulated services will perform at the same response times. Select No.

6 import

7. Now you should have a NewSimulation1 with 2 Tests. If you select the first, you see in the Request tab,  URL /search?term=alt-J Rule: Exists as 1st rule. The second test URL /search?term=the+black+keys Rule: Exists. Rename your Tests to alt-J search and Black_keys search.

7 Rename

8. If you select the Response tab, you can see the JSON response captured. If you wanted to make any changes you could could just edit it here.  At the bottom is a tab for the JSON, but you can also see the Response Runtime Variables in much the same way you see them in SOAPSonar.

8 response

9. lastly, we can set the network listener location and port. Lets name this Listener iTunes Tutorial, leave the IP as 0.0.0.0 (all machines) and change the port to 8888. Lets leave the URI / and commit. Now the simulated service will run on localhost or http://127.0.0.1:8888/

9 listener

10. Now lets run the simulation in the realtime player. Select Start Local Simulation by clicking on the green arrow icon. The Free Simulation Player launches and you can see the iTunes Tutorial Simulated service. Below are the 2 services we captured. Copy the URI.

10. player

11. Now lets “test” these new simulated services. Clone or add 2 new services and use http://127.0.0.1:8888 and then the query for

  • http://127.0.0.1:8888/search?term=alt-J and GET
  • http://127.0.0.1:8888/search?term=the+black+keys and GET

Commit and send each one.

11 Simulated

Did you get a response? Can you tell it is different? Perhaps I need to do another tutorial showing a regression test of a real service vs a virtialized?

Comments/ questions?

5. SOAPSonar – Defining Success Criteria


Just because a response code is response code is 200 range or not in the 400 range, does not meant that the test met with with the business requirements a tester is required to test for. For a list of Status Codes look here. This is represented by the Success criteria or Baseline arrow vs Outcome.

SOAPSonar Test Cycle

Perhaps your test case requires a specific code, value, response time or some other form of validation. Responding with a fax number instead of phone number, or the wrong persons number, is still a defect. For this reason, SOAPSonar offers a variety configuration options, to define what is indeed a successful test case and what is not. Lets start again with our SOAP example we used in Tutorial 4, and use the same .csv data sources for calculate and maps

1. Launch SOAPSonar and Open the test case from Tutorial 4. If you did not do that tutorial, now is a good time. Check that you have both Automation data sources under Configuration, Data Sources by going and in checking the columns. Check also you have our SOAP calculate Service and JSON Google Maps service.

1 check ADS

2. Lets use Subtract_1 service. Select it,. then in a= right-click and select [ADS] Automation Data Source, Quick Select, Calculate, Input a. Then in b= select [ADS],Input bCommit.

2. Subtract

3. Lets run this in run view. Select Run View, delete any existing test cases and drag Subtract_1 under the Default Group. Commit and Run Suite. How many test cases did you run and how many passed? I had all 10 pass.

3 Run suite

4. Now lets go back to Project View and define some additional success criteria. Select Subtract_1 and next to the Input Data tab, is a Success Criteria Tab. Select Success Criteria Tab and Add Criteria Rule.

4. Add success

5. Lets first add a rule for Response Time. Performance is after all a functional requirement and so should be part of functional testing. Lets just say 1 second as max value.

5 Timing

6. Now lets compare the result in column 4 of our .csv. Add Criteria Rule, Document, XPath Match. Then select your new rule and refresh if you need to. Look for SubtractResult parameter and right-click on it. Select Compare Element Value. Notice the Criteria Rules tab changes.

6. XPath

7. Select The Criteria Rule tab, then set match function to Exact Match. Then Choose Dynamic Criteria, Independent Column Variables, Calculate.csvSubtract Result Column from our [ADS]. Ok Commit.

7 Dynamic

8. Switch to Run View and lets run this test again. Commit, Run Suite. This time 9 passed and 1 failed. If you check that .csv file, line 3 subtract value answer column is wrong. The result being 10, yet the expected value being 5. Without defining Success criteria, this would have being missed. Performance wise I had no failures and responses were good.

8 Run

9. Now lets see if we can do this with JSON. Select Google Maps test, in Run View, clear the DefaultGroup, drag Google Maps over and Commit and Run Suite to make sure it is working. All 6 of mine passed.

9 Maps

10. Back in Project View. Select The Success Criteria Tab, and Add Criteria Rule, Timing, for a maximum response of 1 second.  Then Add Criteria Rule, Document, XPath Match. Select it and look for the distance, value. Right-click on it and Compare Element Value.

10 Google

11. Select the Criteria Rules, set Match Function to Exact Match and select icon Choose Dynamic Criteria, Independent Column Variables, your googlemaps.csv, Meters column. Ok, Commit.

11 Exact

12. Run Default Suite. This time 2 of the 6 test cases failed for me, although the time was near, in both cases, it was because my csv had a different value. We will look into report view in our next tutorial.

12 Report

Conclusion

Being able to mix performance, and various header and message requirements into a multiple rule set to define success criteria, allows for automation to reflect business requirements. This helps ensure that you are not just testing Status codes, or incorrect functionality, but the full response. Taking the time to define each test case with the right success criteria initially ensures that your baseline, performance and other systems tests are more accurate.

The arrow from the enablers to the data sources in the diagram at the top of the page, indicates the ability to use direct SQL or other calls to enablers to compare the values with those found in the response. Allowing success criteria to include validating the service is selecting the right value from the enabler.

Comments?