Search for:

10. SOAPSonar – Distributing Load Testing Geographically

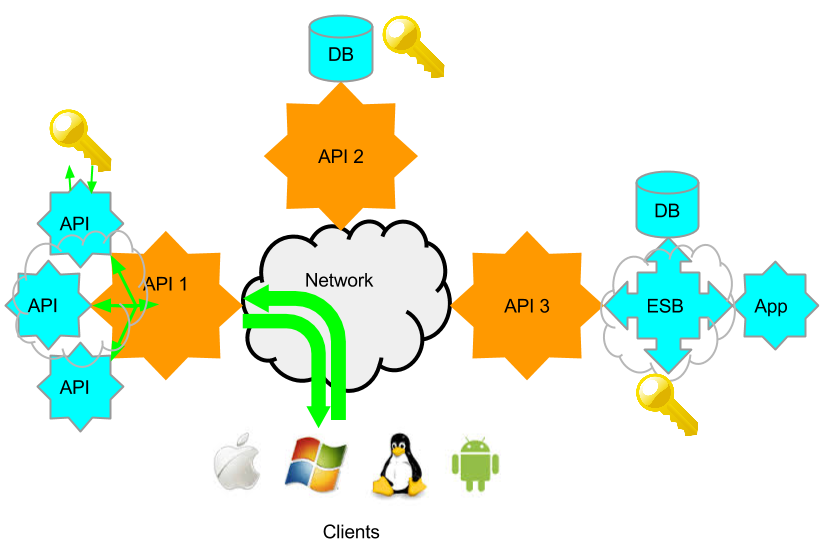
Physically distributing the location of load test clients has 2 benefits. Firstly, it overcomes the limitations of network segment and  works station resources. Secondly it allows for the testing and understanding of the impact of network and location on load and performance.

Yes, you could run around, call different people and press the button at the same time, but integrating the test results can then be very difficult. Triggering a load test from a single central instance, across multiple physical machines, and centralizing the report generates a single drill down report.

In my previous tutorial we load tested using 3 virtual machines, using only one physical machine – SOAPSonar. This tutorial carries on were that one ended, so please do tutorial 9 first if you have not. This tutorial will now distribute the same test across multiple physical machines or “agents”

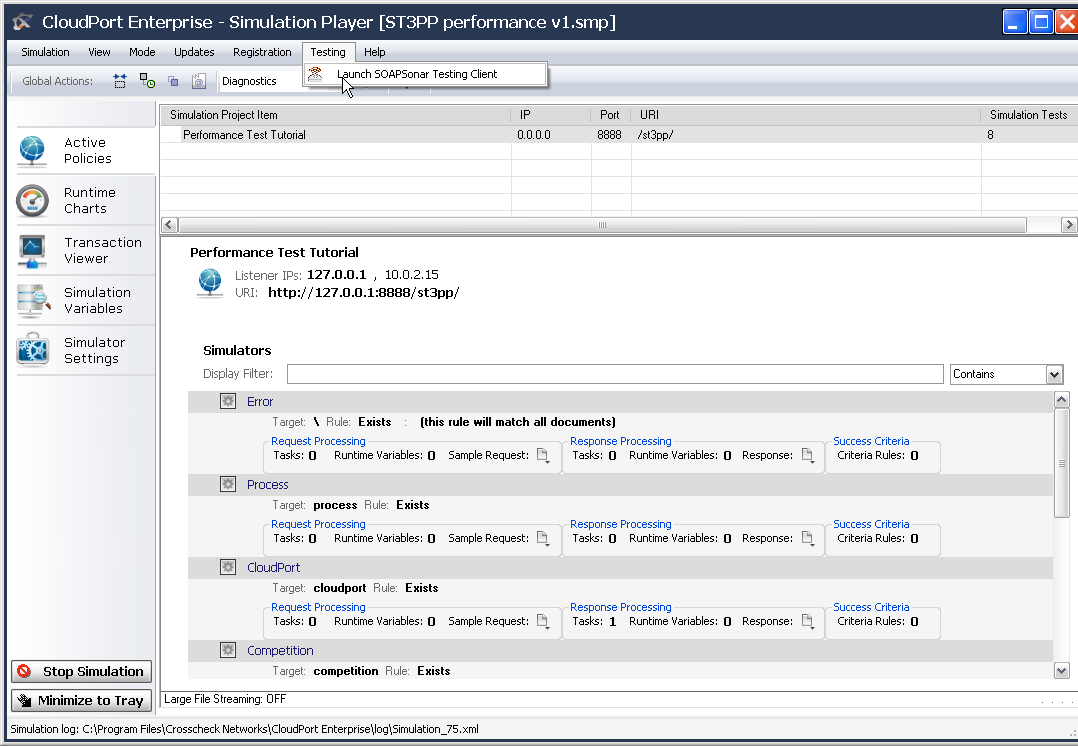
1. Check to make sure you still running the CloudPort Runtime and Performance Test Tutorial is loaded. this will be the service we will load test against. Confirm the IP address and URI.1 runtime

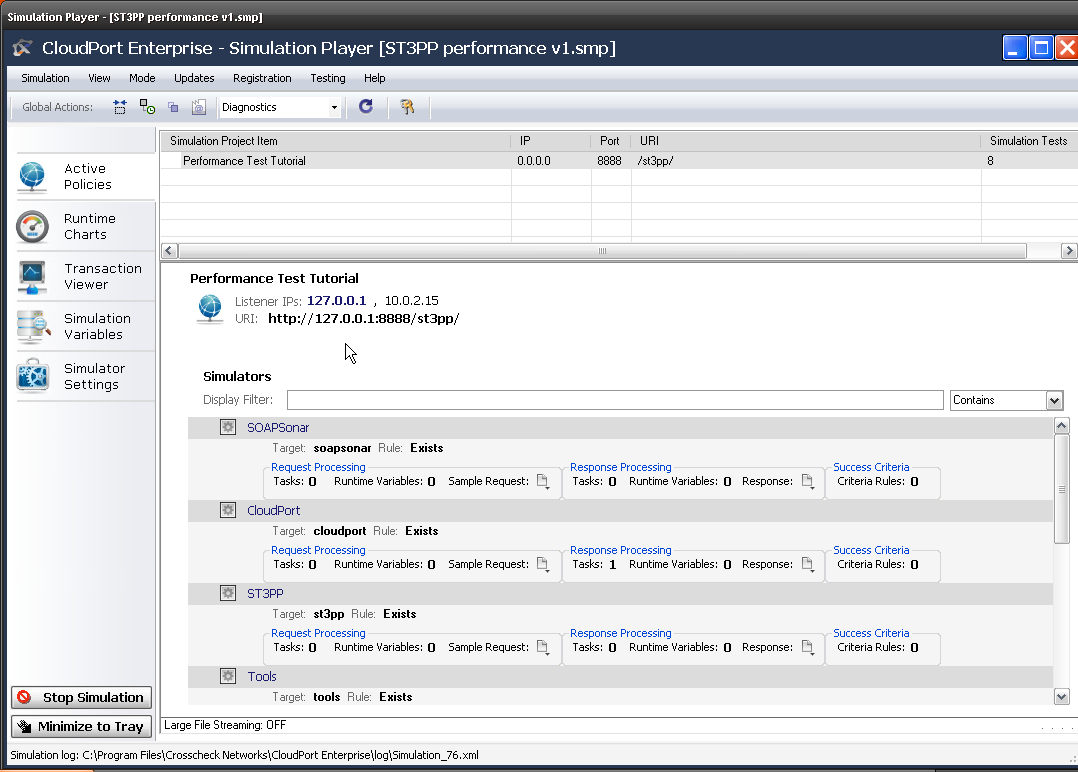
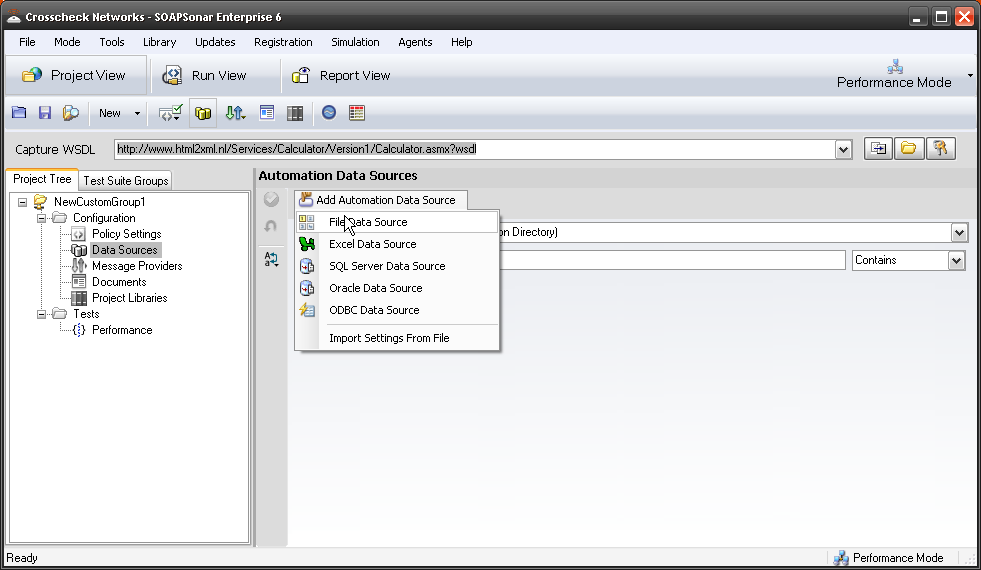
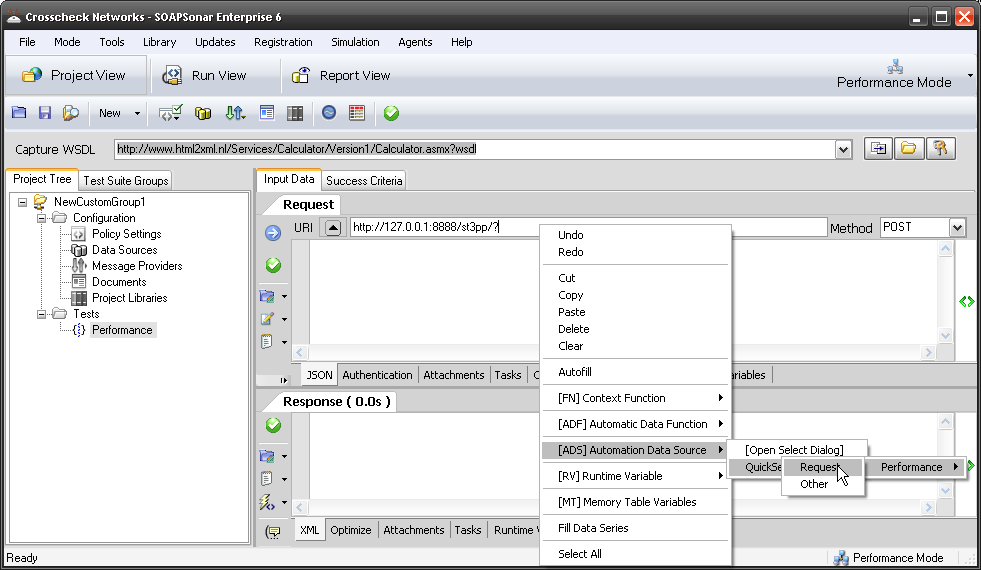
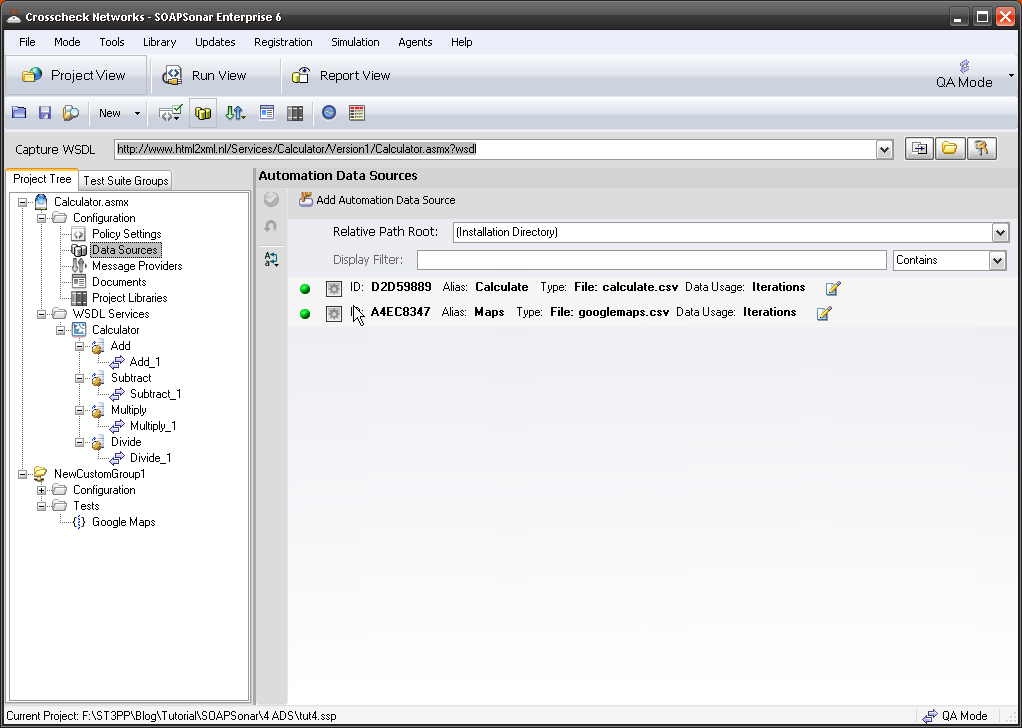
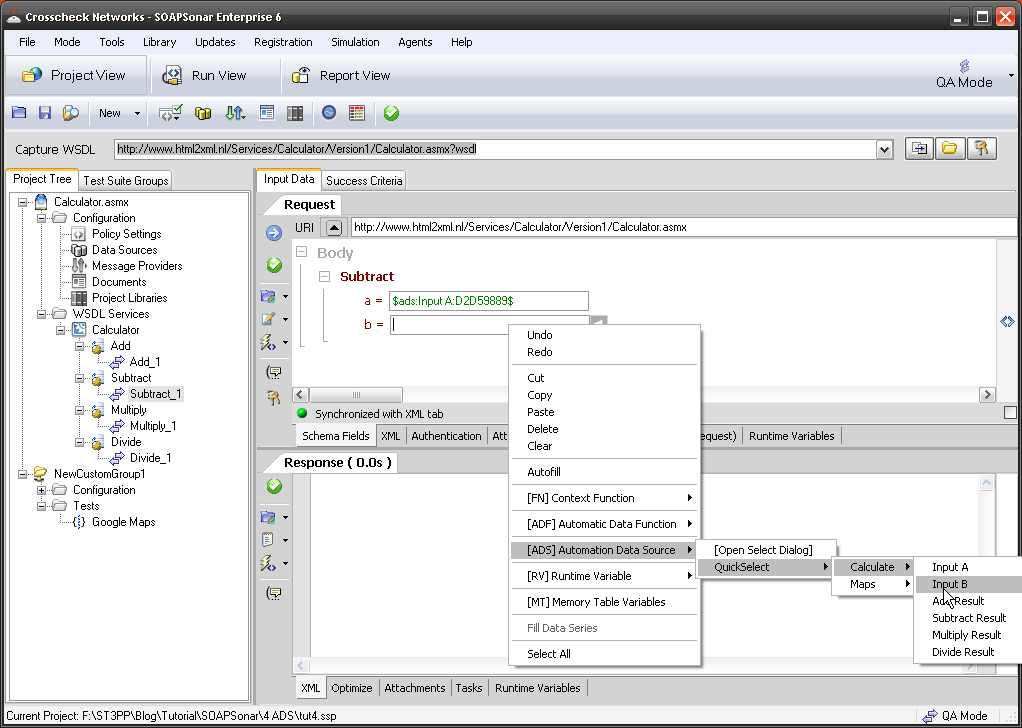
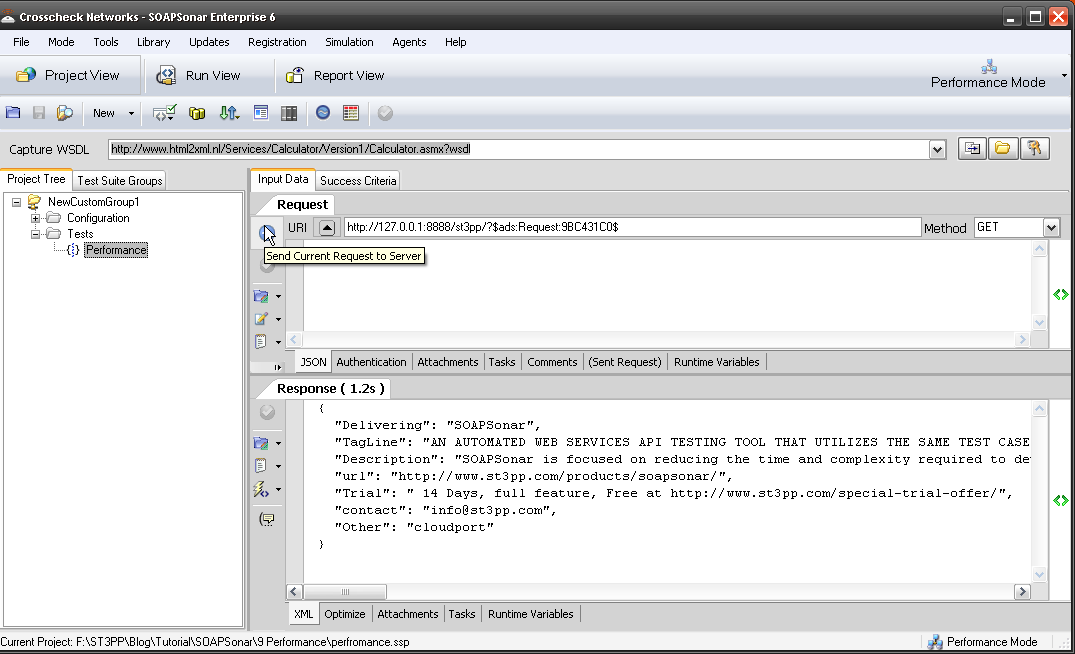
2. Launch SOAPSonar and go back into Project view and just run a quick Send request to server to make sure it is all working still. This confirm your [ADS] is in place and your runtime is up and URI is right.

2 SOAPSonar

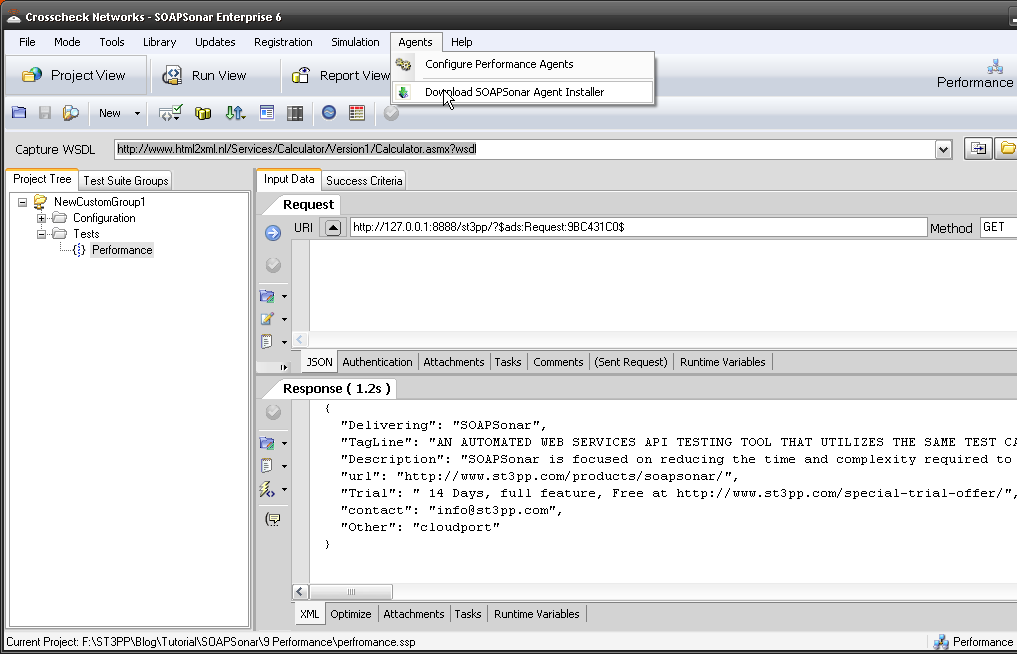
3. Now we need to download our Physical Agent client software. Select Agents in the Top menu (next to help) then Download SOASPSonar Agent Installer. Your browser should launch and you should be able to download the latest agent by selecting it. Its important to keep your SOAPSonar Release and the Agent on the same release. Install the agent on your own machine or another if you would prefer.

5. Agent port

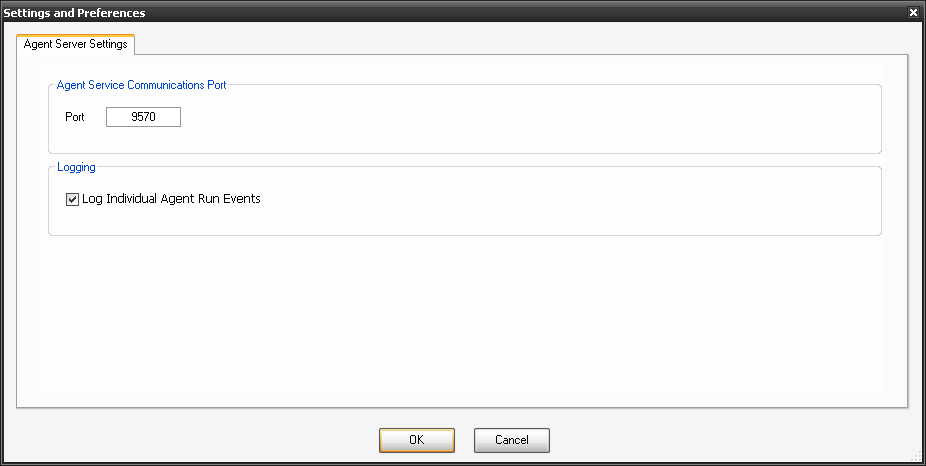
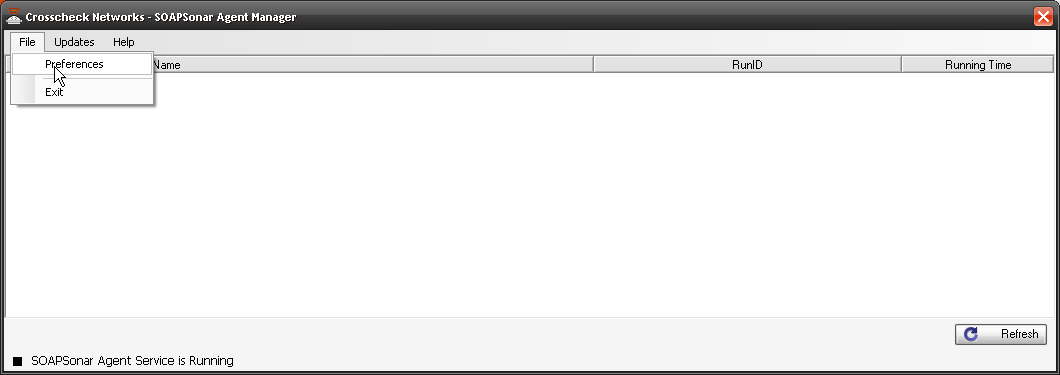
4. Run the agent software after installation and select File, Preferences.

4 agent preferences

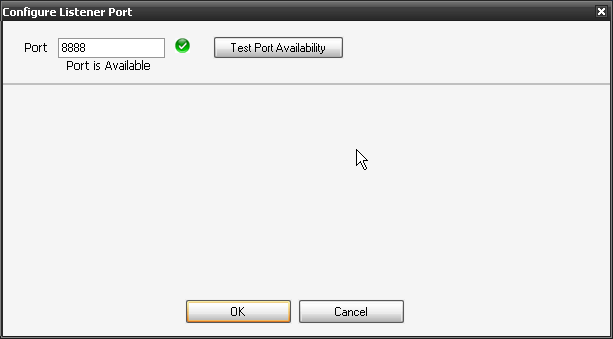
5. Confirm your port and Select Log Individual Agent Run Events. You should now see CloudPort and Agent in your task bar.

3 Download

5.1 taskbar

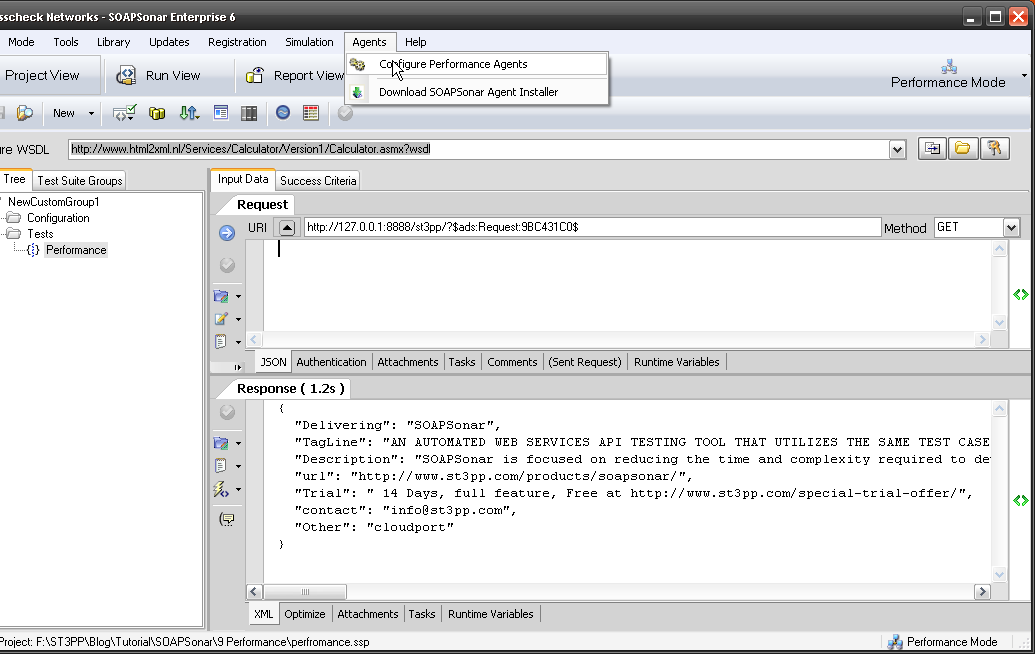
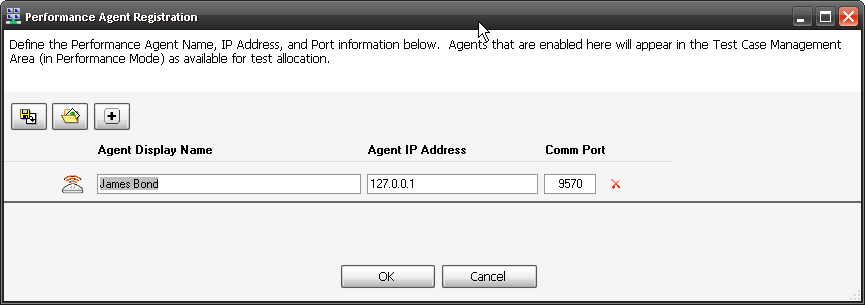
6. Now we need to tell SOAPSonar that we have a agent available.  In SOAPSonar select Configure, Agents.

6 Agents

7. Select the Icon for add a New Agent, Give it a name that so you remember were it is. (like Montreal, Vancouver, Halifax, London or in my case James Bond). Then the IP address of the Agent (in my case its local so 127.0.0.1) and confirm the same port we checked in 5 above. Select OK. We now have a Agent to use along with our local instance in load tests. The idea is not to have it on the same machine for load tests, and preferably on a different network segment, but this is just a tutorial on how.

7 james

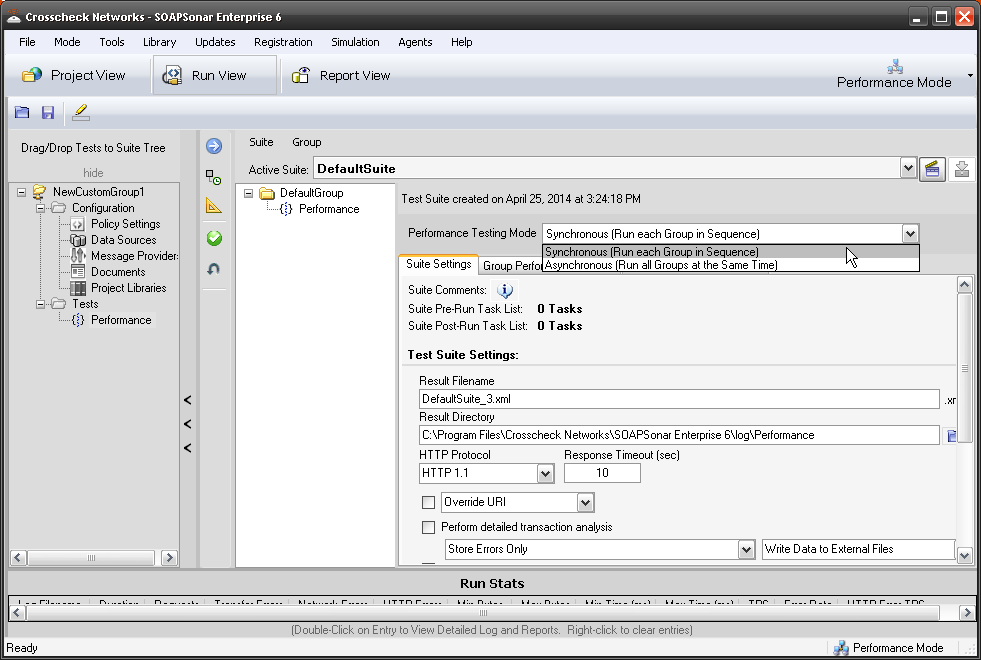
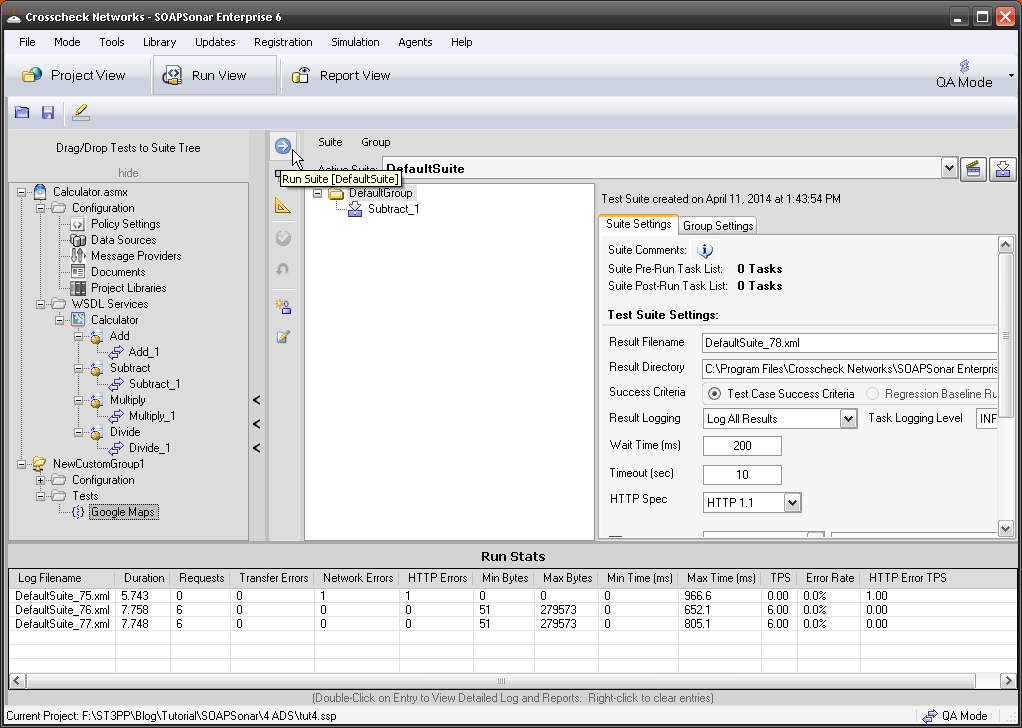
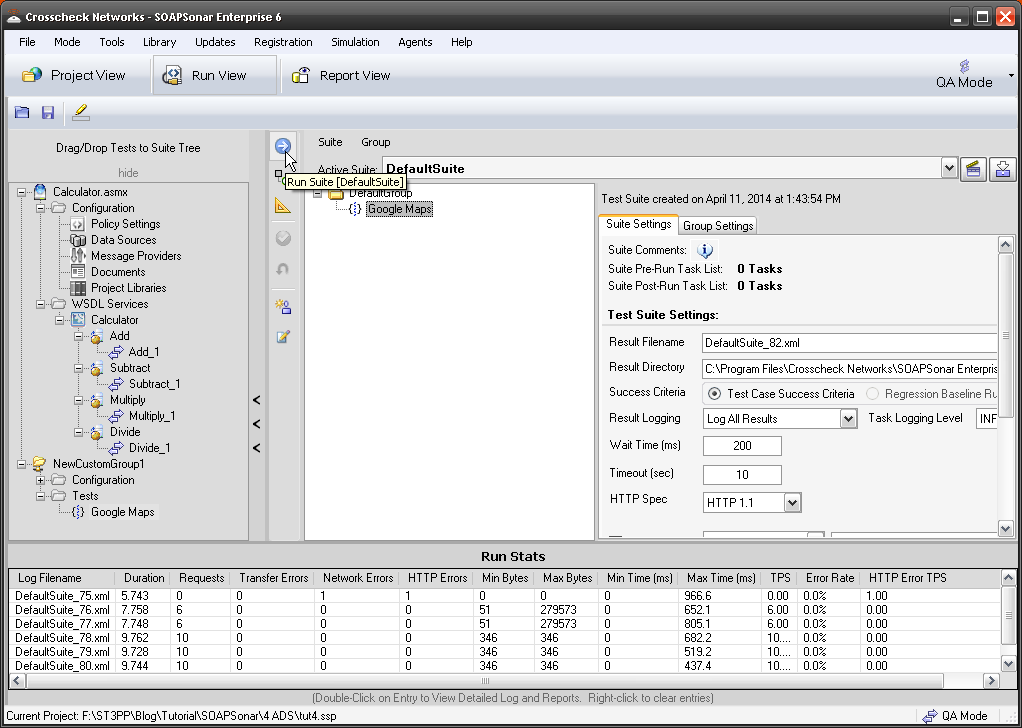
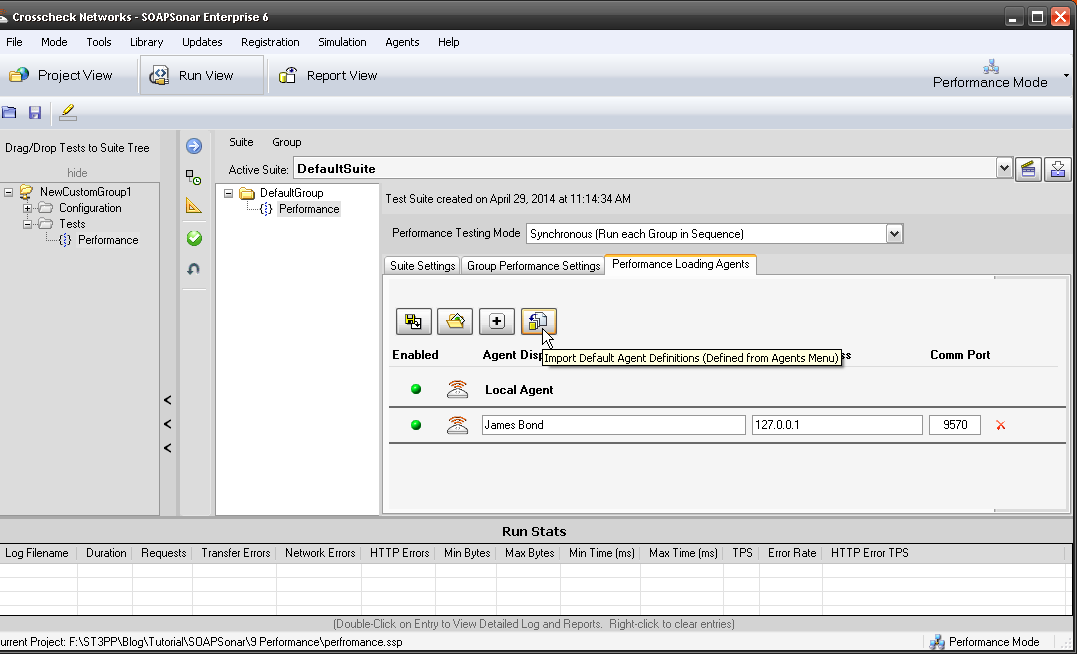
8. Now switch to Run View, and we should still have the same DefaultGroup and Group Performance Settings from the previous tutorial. Select Performance Loading Agents. Select Import Default Agent Definitions icon and your agent should be shown. Activate it by selecting the Red dot to Green. Commit settings to save your agent. 

8 activate

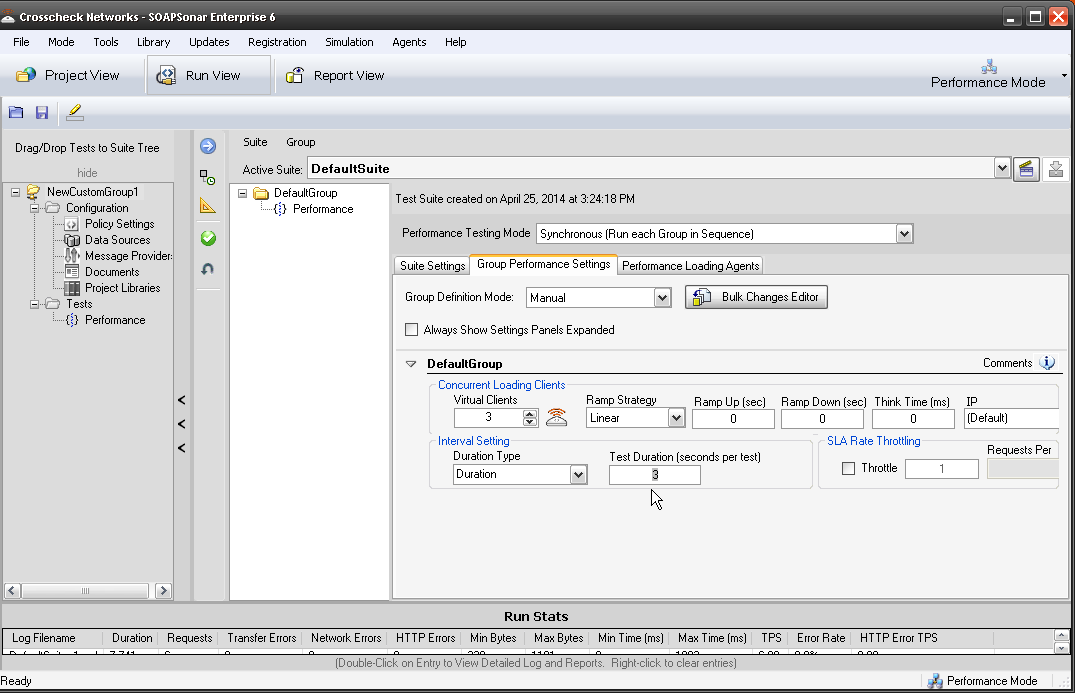
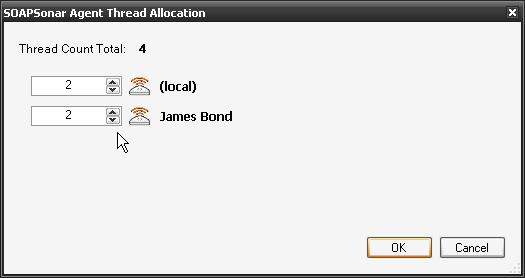
9. Now all we have to do is allocate how many virtual users to each agent. You have both your local SOAPSonar instance or Local Agent and then the new one we created. Select Group Performance Settings and change the Virtual Clients to 4. Then right next to that, select the icon for Agent Thread Allocation.

9 Add Virtual

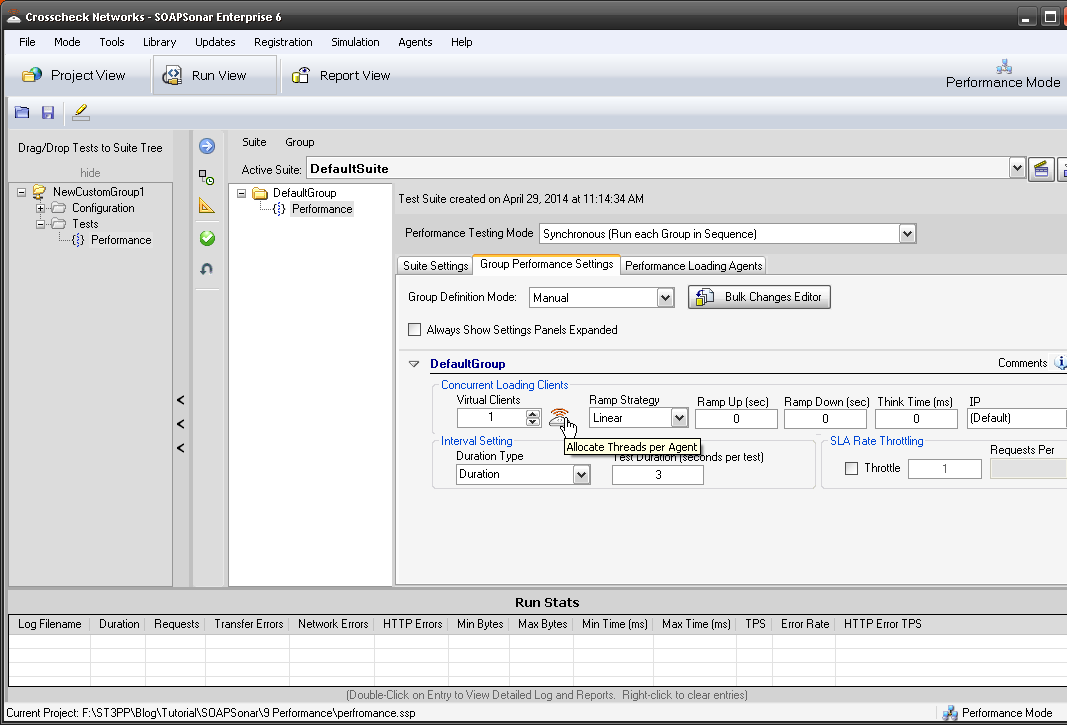
10. Lets give 2 Virtual Agents to each of or physical agents. Confirm duration is 3 seconds and Commit and Run Suite.

10 alocate

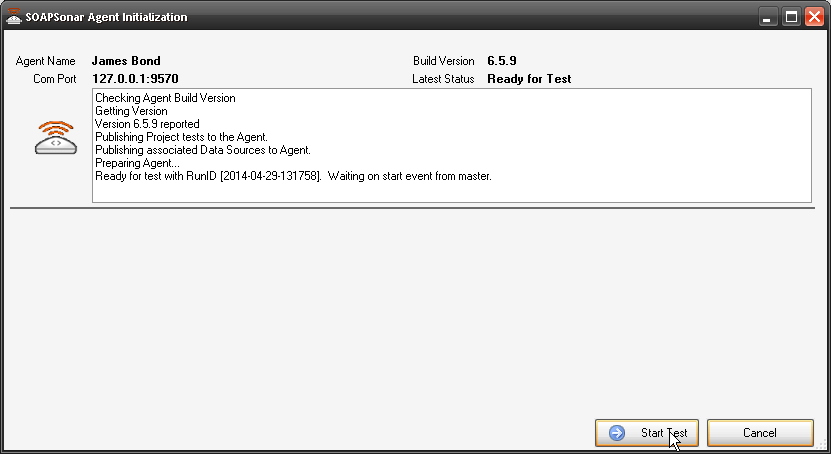
11. You should now see the Agent Initialization Screen. Once the agent is initialized, select Start Test. If your agent does not initialize, check the IP address and Port and ensure you can ping the agent.

11 Agent initialize

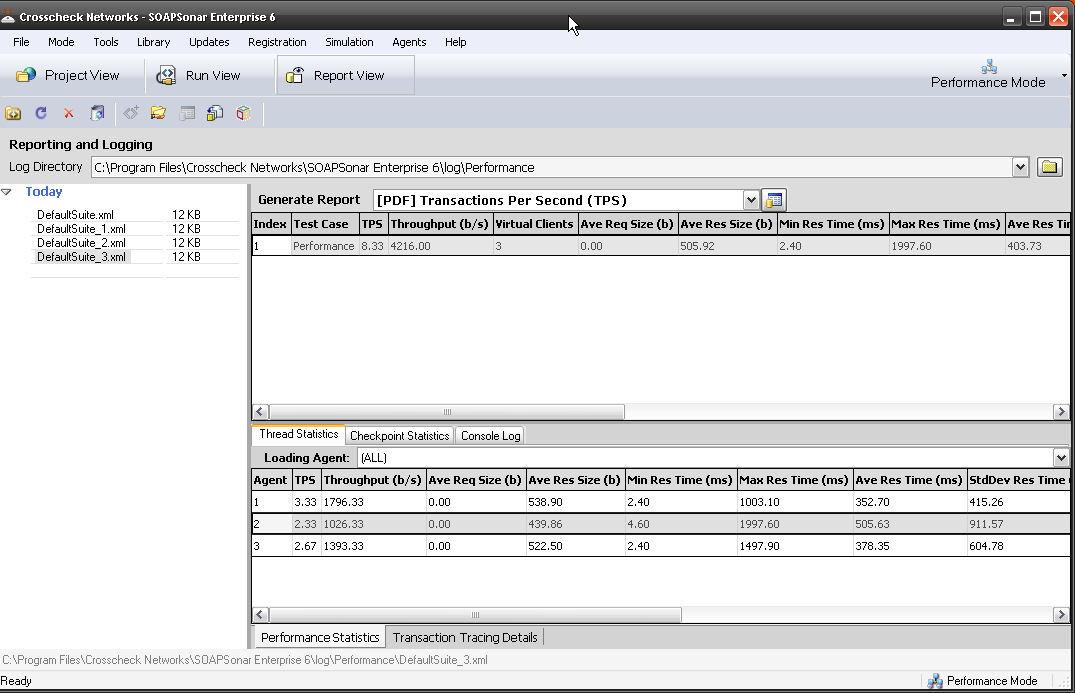
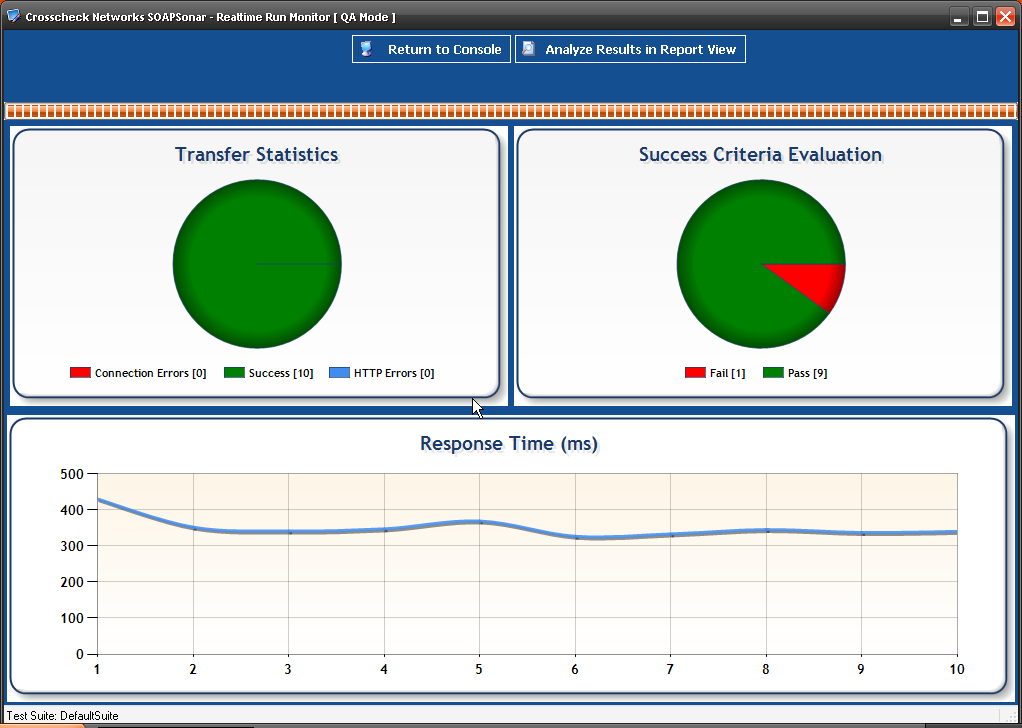
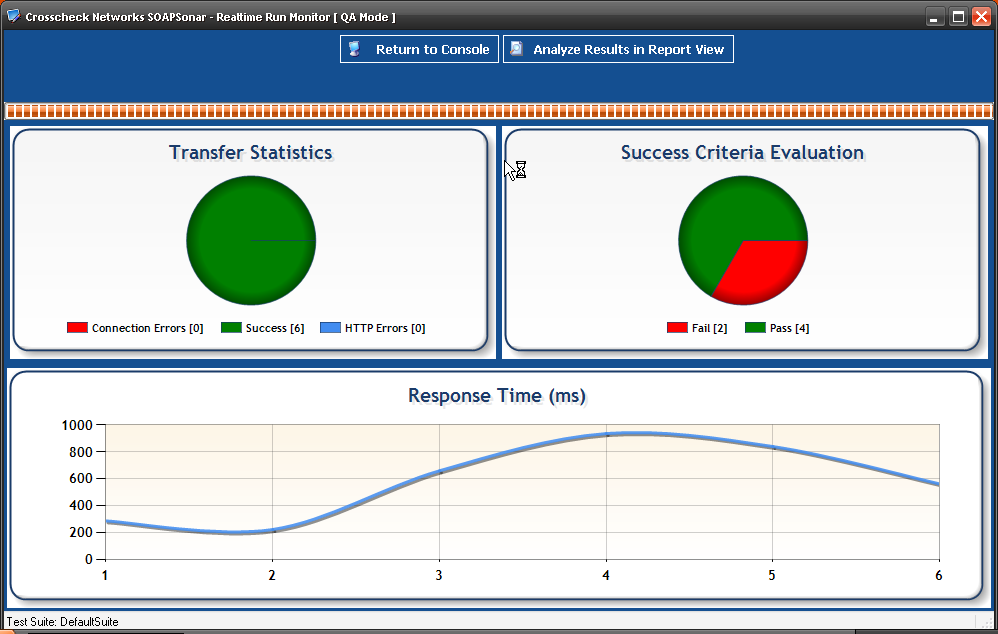
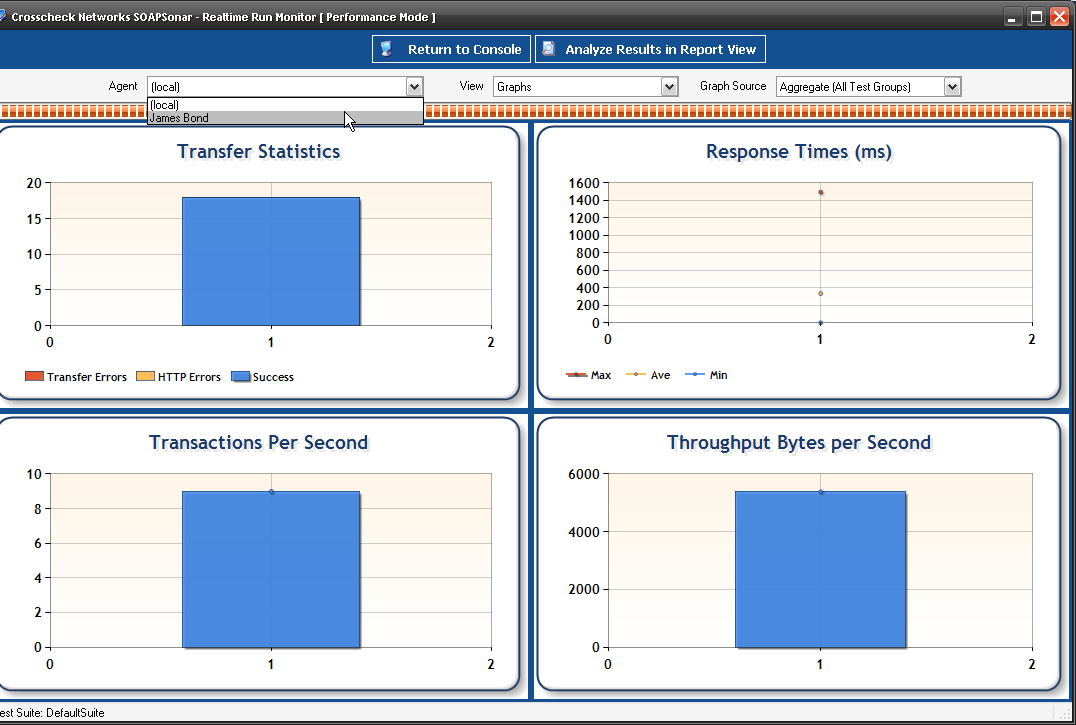
12 In the Real-Time Monitor, you see you can now view performance by physical agent.

12 Real time

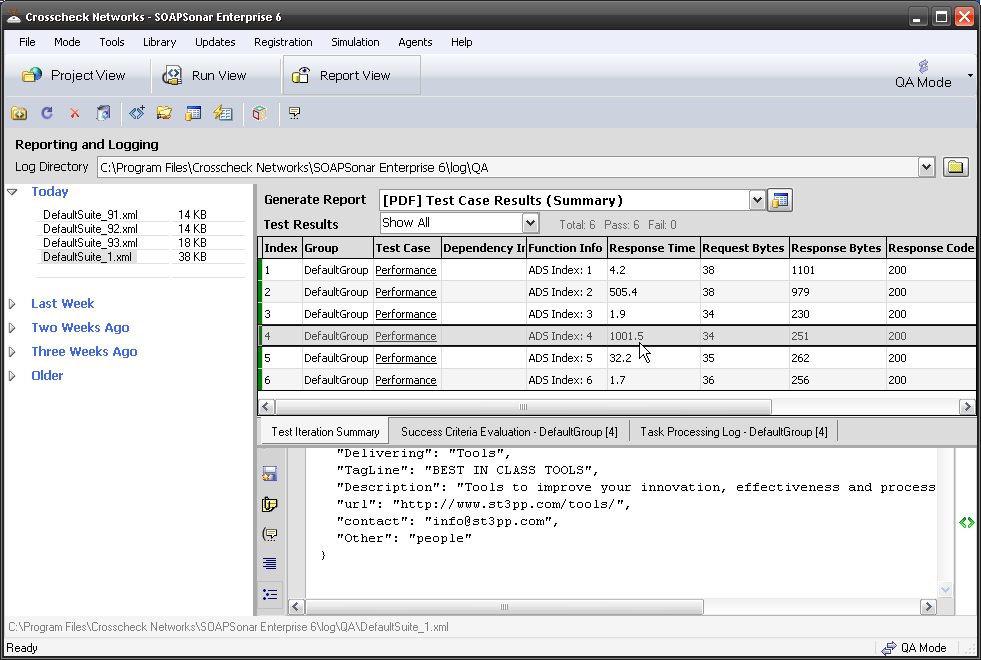
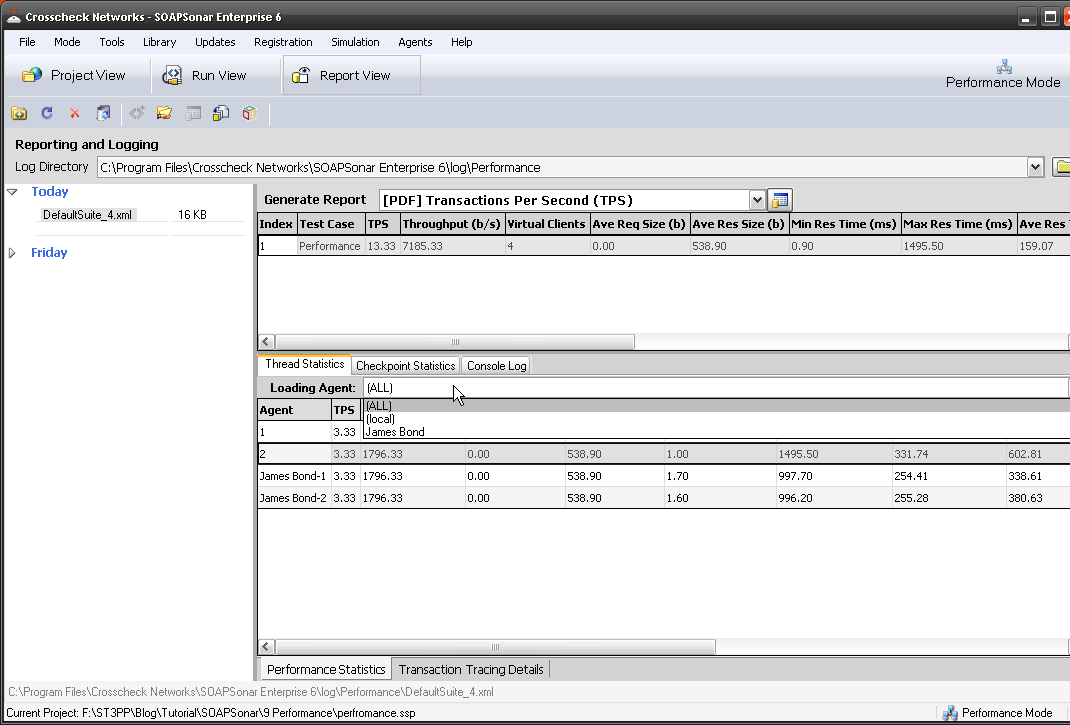
13. In Report View, you can now show performance for one Physical Agent, One Virtual Agent or aggregated. This allows to to compare performance from one physical location to another.

13 Repaort

Conclusion

Distributed agents is part of the Server Edition of SOAPSonar, along with expanded number of virtual users. Physical Load agents allows performance testing to scale through distributing the agents and resources. It also allows for testing of network infrastructure as well and application performance. Using the same Test Suite again as we use for functional testing, regression and performance to save time and be easily automated.

This is the end of the introductory series of Tutorials. If you doing a trial and just looking for a high level understanding how SOAPSonar can help you, you should be on your way. From time to time I will post new tutorials on new features, different options and greater challenges. Other features not as of yet used.

In the mean time, let us know how you enjoyed these. Private comment in the form below and public by starting a discussion at the bottom of the page.

Warning: strpos() expects parameter 1 to be string, array given in /home/content/13/11164213/html/ST3PP/wp-includes/shortcodes.php on line 193
[contact-form to=’[email protected]’ subject=’I just completed SOAPSonar Tutorial 10′][contact-field label=’Name what you want to be called.’ type=’name’ required=’1’/][contact-field label=’Email if you want a response.’ type=’email’/][contact-field label=’Comment. ‘ type=’textarea’/][/contact-form]

Comment or suggestions always welcome.


9. SOAPSonar – Performance

One of the benefits of SOAPSonar is that performance and load testing use the same automation tests developed for functional testing. You just need to switch the mode from QA to Performance on the top right. All data sources, Projects, Test Cases and Test Suites remain unchanged. This allows performance and load tests to be built into functional requirements and regression testing, without creating a new series of test cases in a separate tool.

In order to do performance and load testing, and prevent any accidental denial of service attack, we need to use a CloudPort runtime. Its free, it local and it integrates well with SOAPSonar. Its also a useful tool to have and one we will use for a number of future tutorials. So lets go ahead and download and install it.

1. Download and install the CloudPort Runtime Player. You have to accept export restrictions, but are not asked for no personal information.

2. Secondly, download the runtime, ST3PP performance and unzip it to a location you can find again. You should have 3 files. Tutorial v1 and v2 and a short csv. We use V2 in future tutorials.

3. Launch the CloudPort Runtime Player and select run simulation, then find Tutorial v1 you downloaded and unzipped in step 2. Start Simulation Player. Accept port 8888. (good idea to Test availability)

3 run player

4. You now should have a JSON Simulation running on your machine to test against. If you look under Performance Test Tutorial, next to the icon of the networked globe,  you will see the URI should be http://127.0.0.1:8888/st3pp/ and the list of simulated services running, starting with soapsonar. Lets not change anything else here yet, but copy the URI http://127.0.0.1:8888/st3pp/.

4. Simulation

5. Leave the runtime running and launch SOAPSonar and lets create a basic JSON test case. You can do this by selecting Testing and then Launch SOAPSonar Testing Client from within CloudPort runtime or you can just run SOAPSonar as you usually do. Select File, New, Test Group then Right-click on Tests in the Project Tree and Select New JSON Test Give it a name like Performance

5. New Test

6. There is a small CSV file in the zip file you downloaded in step 2 called performance.csv. Lets add that as an [ADS]. In the project Tree under configuration, select Data Sources. Add Automation Data Source, then Select File Data Source. Give it an alias, find the performance.csv you extracted and ensure the Data Variables is on Request column, then select OK.

6 ADS

7. Back at our test case “performance“, paste the URI copied from CloudPort or http://127.0.0.1:8888/st3pp/ into the URI. Then add the query. In this case it will be ? followed by right-click and the [ADS] and our Request column. Set the method to GET (although it matters not in this runtime). Commit and Send Current Request to Server. Did you get a response that’s not a error? So far this has all being covered in earlier tutorials. your response should start with “Delivering”: “SOAPSonar”

7. Project

8. Select Run View and drag our test case over to the DefaultGroup. Check to make sure you right hand top corner is QA mode and Success Criteria is Test Case Success and not Regression. Then Commit and Run.  All 6 Test cases from the .csv should run and pass. Did they? Select Report View, and notice that 2nd Test case CloudPort took over 500ms and the 4th test case Tools, took over 1000ms. This is because the runtime has some latency added for these two cases. These individual services, not under load perform slower.  So far you have being testing functional testing. If we wanted to we could add a success criteria now and fail any service over a certain response time, now would be a good time.

8 Slow

9. lets go back to Run View and Change SOAPSonar from QA Mode to Performance Mode in the right top corner.  Notice that Suite Settings Changed? Now if we select Run Performance Testing in Synchronous Mode, each test group is run sequentially and each test case performance statistics are isolated and run individually. Asynchronous will run all your test groups at the same time to replicate different traffic patterns. We only have one test in one group. So lets leave it on Synchronous. Lets also leave the rest for now. Careful with logging as it can effect your machines load and hence performance.

9 Synchronous

10. Select the next Tab, Group Performance Settings. Here we establish the number of Virtual Clients and the length and extent of the load. Select just 3 virtual clients and set it to Duration and 3 seconds. Leave Throttle unchecked as we see how many TPS we can hit with 3 Virtual Clients. We have made no changes to the [ADS], functional test, regression or success criteria. Commit and Send.

2014-010 Virtual

11. This time your Realtime monitor is different. In report view, you see a consolidated report, when you select that, you see a break down per virtual client. East virtual client can export a file for further processing or you can generate a report. How  many TPS did you hit? We highly recommend using the 90% Res Time column as a reference, ignoring the 10% of responses that are extra long or short.

11 Report

Conclusion.

Doing load and performance testing as early in the development cycle can be critical in finding the time to address any concerns. Using the same test case and simply switching to performance mode vs developing a new set of test cases in a different tool, enables far greater coverage and reduced time.

In our next tutorial we will use both virtual and physically distributed load agents in a performance and load test.

Take a minute to give me some private feedback in the form below. This will be mailed to me and not published.

[contact-form subject=’Performance Testing’][contact-field label=’Handel’ type=’name’ required=’1’/][contact-field label=’My opinion on Perfromance and Load testing is :’ type=’radio’ options=’Why would anyone do Performance or Load tesing?,We do Performance but not Load testing,We use different tools for Performance and Load testing,We use an integrated Tool for Performance and Load Testing’/][contact-field label=’We do performance testing as part of Coninous and Regression Testing’ type=’checkbox’/][contact-field label=’Comment’ type=’textarea’ required=’1’/][/contact-form]

Otherwise please post any public comments below.

Performance and Load Testing

A second theme of interest that came up repeatedly at STAR Conference last week was Performance and Load testing. Many of those raising the question, had mobile applications or some form of mash-up or worked in Agile environments were performance and functionality were important.

In the SOA or API world, when I refer to Performance, I am referring to a single functional service request to response time taken. The performance of the service as part of the API or web service itself. In the below diagram, it would the time it leaves the client to the time a response is received. The additional API and Identity requests that happen behind the API 1, included. These I refer to as enablers. API 2 has a DB and its identity system, and API 3 is on a Enterprise Services Bus, and has multiple enablers on the bus. Each API may have a number of services associated with it, and each of these may require different enablers, or complete different functions, and so will have different performance characteristics. Granular performance information is therefore important for troubleshooting.

Load Testing, is the performance group of services at a given load. Modelled, using expected behaviour. If function 1 in API 1 is expected to be accessed 5 times that of function 1 of API 2, then the model needs to load Function 1 in API 1 5 x that of function 1 API 2. Load testing can either be throttled to evaluate performance times at a planned TPS or simply increased till errors start occurring, to understand maximum TPS possible.

User experience performance is the perceived performance via a given client. Here we add the performance of a given client to that of the network, API and enabler. User experience does not embrace device / client diversity. Caching, partial screen refreshes, and a variety client tweaks, may hide some perceived performance issues. That said, unless the API performance is know, a poorly performing client can be difficult to identify.

Performance

The most common performance issues that tend to come up, are problems not with the API themselves, but with the enablers. Some back-end database, identity system or ESB that may have some other process running on it at a given time (e.g. backup), has a network issue or requires tuning. Often these issues are due to changes in the environment or only at a given time. A single load or performance test run, a few days before final acceptance, often fails to identify these issues, or the issues occur in production at some later date.

I previously wrote a long multi-part series about performance troubleshooting in mobile API and I have no intent to repeat that. The constant surprise however, when I show a shared test case being used for functional and performance testing, is why  wanted to add some clarification. Usually I get a blank stare during a demo for a few minutes before a sudden understanding.  So many QA testers have being trained to think of different tools and teams for functional and load testing, that the concept of a integrated tool can be difficult to grasp at first, requiring some adjustment in thinking.

After the adjustment occurs, I consistently get the same 2 questions

  1. “Does that mean you can define performance as a function of success criteria?” Yes, each test case for each service in each API, can have a minimum or maximum response time configured in success criteria. Say you set that value as 1 second along with any other criteria for success. If at any time later on that test is run, including load testing, the test case will fail. There is no need  to create new test scripts, data sources, variables etc for load testing in a separate tool. If its a new team, just give them the test case to run.
  2. Does that mean you can do continual testing or regression testing, on production system and identify any changes in functionality AND performance at the same time?  Yes. If the value is set at 1 second response in success criteria, and  you configure a automated regression or functional test every hour/day/week/ whatever. If at any point, performance or functionality changes, the test case would now fail as the response would be different than expected or previously. There is no need to run 2 separate applications to continually test service for changes in functionality and performance.

At this point I usually point out the benefit of physically distributed load agents vs. just virtual users.  The ability to trigger a central test from multiple locations in your network and compare response times, allows not only the simulation of Server, but also the Network. Larger companies often break out network performance turning into another team, and don’t consider it an “application issue”. I believe any performance issues is functionally important. Smaller companies, and senior executives, are however quick to the benefits or consolidating this into a single tool and report.

Conclusion

Regardless of if your performance/load team is a separate group or part of your role, sharing a test case, and actually building performance in to the success criteria in the same tool can offer huge benefits in time savings and in identifying performance issues earlier in development cycle and during maintenance. Why not try it yourself? Here is a two tutorials on Load Testing and Geographically Distributed Load Testing.


5. SOAPSonar – Defining Success Criteria


Just because a response code is response code is 200 range or not in the 400 range, does not meant that the test met with with the business requirements a tester is required to test for. For a list of Status Codes look here. This is represented by the Success criteria or Baseline arrow vs Outcome.

SOAPSonar Test Cycle

Perhaps your test case requires a specific code, value, response time or some other form of validation. Responding with a fax number instead of phone number, or the wrong persons number, is still a defect. For this reason, SOAPSonar offers a variety configuration options, to define what is indeed a successful test case and what is not. Lets start again with our SOAP example we used in Tutorial 4, and use the same .csv data sources for calculate and maps

1. Launch SOAPSonar and Open the test case from Tutorial 4. If you did not do that tutorial, now is a good time. Check that you have both Automation data sources under Configuration, Data Sources by going and in checking the columns. Check also you have our SOAP calculate Service and JSON Google Maps service.

1 check ADS

2. Lets use Subtract_1 service. Select it,. then in a= right-click and select [ADS] Automation Data Source, Quick Select, Calculate, Input a. Then in b= select [ADS],Input bCommit.

2. Subtract

3. Lets run this in run view. Select Run View, delete any existing test cases and drag Subtract_1 under the Default Group. Commit and Run Suite. How many test cases did you run and how many passed? I had all 10 pass.

3 Run suite

4. Now lets go back to Project View and define some additional success criteria. Select Subtract_1 and next to the Input Data tab, is a Success Criteria Tab. Select Success Criteria Tab and Add Criteria Rule.

4. Add success

5. Lets first add a rule for Response Time. Performance is after all a functional requirement and so should be part of functional testing. Lets just say 1 second as max value.

5 Timing

6. Now lets compare the result in column 4 of our .csv. Add Criteria Rule, Document, XPath Match. Then select your new rule and refresh if you need to. Look for SubtractResult parameter and right-click on it. Select Compare Element Value. Notice the Criteria Rules tab changes.

6. XPath

7. Select The Criteria Rule tab, then set match function to Exact Match. Then Choose Dynamic Criteria, Independent Column Variables, Calculate.csvSubtract Result Column from our [ADS]. Ok Commit.

7 Dynamic

8. Switch to Run View and lets run this test again. Commit, Run Suite. This time 9 passed and 1 failed. If you check that .csv file, line 3 subtract value answer column is wrong. The result being 10, yet the expected value being 5. Without defining Success criteria, this would have being missed. Performance wise I had no failures and responses were good.

8 Run

9. Now lets see if we can do this with JSON. Select Google Maps test, in Run View, clear the DefaultGroup, drag Google Maps over and Commit and Run Suite to make sure it is working. All 6 of mine passed.

9 Maps

10. Back in Project View. Select The Success Criteria Tab, and Add Criteria Rule, Timing, for a maximum response of 1 second.  Then Add Criteria Rule, Document, XPath Match. Select it and look for the distance, value. Right-click on it and Compare Element Value.

10 Google

11. Select the Criteria Rules, set Match Function to Exact Match and select icon Choose Dynamic Criteria, Independent Column Variables, your googlemaps.csv, Meters column. Ok, Commit.

11 Exact

12. Run Default Suite. This time 2 of the 6 test cases failed for me, although the time was near, in both cases, it was because my csv had a different value. We will look into report view in our next tutorial.

12 Report

Conclusion

Being able to mix performance, and various header and message requirements into a multiple rule set to define success criteria, allows for automation to reflect business requirements. This helps ensure that you are not just testing Status codes, or incorrect functionality, but the full response. Taking the time to define each test case with the right success criteria initially ensures that your baseline, performance and other systems tests are more accurate.

The arrow from the enablers to the data sources in the diagram at the top of the page, indicates the ability to use direct SQL or other calls to enablers to compare the values with those found in the response. Allowing success criteria to include validating the service is selecting the right value from the enabler.

Comments?

KPI – Identifying Areas in Process that Requiring Tuning

Both Six Sigma and CMMi focus on creating and managing a feedback loop. Assessing the current status in your organization and then identifying areas for improvement.  To do this, KPI or Measurement Objectives are needed to measure the effectiveness of your organizations Tools, People and Processes. Measuring details like Defect Density, Test Coverage, Total defects, reliability etc. Then collecting the relevant data and analysing these measurements to provide insight into the the results, set goals and track progress.

One of my favourite tools or methods to visual and analyse KPI is via Pareto Graph. Its simplicity makes the 80/20 rule stand out to any level of an organization. In the above example the first 7 groups of defects is clearly well over 80% of the all defects. The impact of addressing the others being minimal, while a small change in the first 3 could have major impact to your organizations quality.

Potential issues with Pareto Graph.

Although extremely helpful in identifying areas that need to be addressed, there are some potential pitfalls on relying on Pereto analysis too much. These include

  1. It is important to define and group the categories correctly. They need to both be precise, so that there can be little doubt as to which category the defect fits into and they need to be of a suitable granularity. Making larger groups, can make addressing the sub issues in the groups difficult, yet making too many sub-groupings can result in loosing the visual effect and intent of the pareto.
  2. Selecting appropriate time periods is important. Measuring only a single release cycle or team, can result in wild fluctuations in results. Consolidating multiple teams, releases etc can cloud visibility into a particular team or release issues.
  3. If changes are made to the Tools, People and Process, to address the issues identified in the  pareto chart, adding them to the same period will not offer any insight into the effectiveness of these changes. These changes need to be compared to a previous baseline. Baselines however can become rapidly dated.
  4. Pareto analysis is draws focus on areas of greatest need, but a laser focus only on those areas, can rapidly destabilize others. Some of these other fixes could be potentially low hanging fruit requiring little effort to resolve.
  5. Although Pareto analysis identifies common areas that may require focus or consideration, it does not supply solutions.

Poll

What I have learnt is that when someone sits down and actually gathers the information and generates a Pareto chart for analysis, they are almost always surprised by what is revealed. For benefit of all,  I wanted to take a short Poll.  First off, looking at teams that do use pareto analysis and teams that don’t.  What I would be interested in seeing, is if these teams see common or different set of issues. In other words, does doing a pareto analysis change peoples list of most common defects. The results will be collected privately and consolidated by me, and posted at a later date. Comments at the bottom of the page posted before hand for public, but comments in the poll kept private unless you stipulate in them you wish to be mentioned.

Please take a minute to weigh in and help others ST3PP ahead.

[contact-form subject=’pareto analysis’][contact-field label=’Screen Name’ type=’name’ required=’1’/][contact-field label=’Does Your Organization Use Pareto Analysis’ type=’radio’ required=’1′ options=’Yes – we review them frequently,No – I have never seen one for my organization’/][contact-field label=’1 – Most Common Defect Group’ type=’select’ required=’1′ options=’Business Changes – Missing or added business functionality,Design Defects – Missing or incorrect architecture requirements,Developer Defects – Missing or defected functionality in code,Environmental Defects – Versioning%26#x002c; enablers or other other site issues,QA Defects – Incorrectly identified as a defect,Other – Please describe in comments’/][contact-field label=’2 – Second Most Common Group’ type=’select’ options=’Business Changes – Missing or added business functionality,Design Defects – Missing or incorrect architecture requirements,Developer Defects – Missing or defected functionality in code,Environmental Defects – Versioning%26#x002c; enablers or other other site issues,QA Defects – Incorrectly identified as a defect,Other – Please describe in comments’/][contact-field label=’3 – Third Most Common Group’ type=’select’ options=’Business Changes – Missing or added business functionality,Design Defects – Missing or incorrect architecture requirements,Developer Defects – Missing or defected functionality in code,Environmental Defects – Versioning%26#x002c; enablers or other other site issues,QA Defects – Incorrectly identified as a defect,Other – Please describe in comments’/][contact-field label=’4 – Fourth Most Common Group’ type=’select’ options=’Business Changes – Missing or added business functionality,Design Defects – Missing or incorrect architecture requirements,Developer Defects – Missing or defected functionality in code,Environmental Defects – Versioning%26#x002c; enablers or other other site issues,QA Defects – Incorrectly identified as a defect,Other – Please describe in comments’/][contact-field label=’5 – Fifth Most Common Group’ type=’select’ options=’Business Changes – Missing or added business functionality,Design Defects – Missing or incorrect architecture requirements,Developer Defects – Missing or defected functionality in code,Environmental Defects – Versioning%26#x002c; enablers or other other site issues,QA Defects – Incorrectly identified as a defect,Other – Please describe in comments’/][contact-field label=’Private Comment To Me’ type=’textarea’/][/contact-form]


Performance Tuning Mobile API – Introduction

Mobile applications offer a number of unique challenges with regards to testing, adding complexity through an expanding number of variables. Along with usual testing concerns, there is an array of devices, with an uncertain network and the emerging mobile services standards themselves.  Business people wish to focus on the user’s experience, attempting to gain some level of certainty in what is still a very uncertain and emerging world. Specifying requirements to developers and QA that can be extremely difficult or costly or even impossible to validate.  Let’s take a poorly crafted requirement “the application screens will refresh in less than 3 seconds on devices and networks”.

When in field testing, a device consistently requires more than 3 seconds to refresh a screen, what is wrong? Did Developers or QA fail to meet with the requirements? When performance is poor, how do developers and testers pinpoint the problem? Is it even a software issue that can be fixed? Is it perhaps the devices memory/CPU load, the screen size or storage space, the client software, or perhaps bug in that particular version or OS. Perhaps it’s the geographic location of the user, the wireless provider, the type of network the user has, the user’s physical location and signal strength. Or perhaps it’s one particular service, identity, encryption, authentication or some 3rd party service used by the mobile application. There are literally thousands of possible causes and combinations, making it impossible to consider, test and validate them all. Tuning however for the best chance of success is possible.

With the problem being the number of variables, it is no surprise that best practices usually involve dividing these variables into groups and then testing to understand the impact each particular group can have on performance rather than attempting to test for every permeation.  By breaking the entire experience into smaller components, and understanding the impact of each component, variances can easily be identified. Although every organization and application is different,   let’s looks at 4 groups.

  1. Client – The device, its operating system, and applications on it, including the your own.
  2. Network – wireless and wired communication from wherever the client is to the Ethernet port of the API.
  3. API – The Services that are Consumed by the Mobile Application
  4. Enablers – The services, like Databases, Identity, 3rd party etc that support the API.

This can be represented as:

User Experience = Enablers + API + Network + Client.

The next post is on understanding the impact of client and on ways to isolate and understand the impact that client has on your overall performance for troubleshooting.