An important reason for Automation, can be the time saved over generating manual reports. Comparing expected results with actual on a case by case basis and sorting through this date to combine it in a meaningful way. Making sense from pages for XML, in an attempt to filter the few key issues. One of the top 5 issues shared with me is false positives, or QA reporting an issue, that was either incorrectly diagnosed or not considered a issue. Much of this can be mistake in what was entered, but just as often, a mistake in understanding the expected behaviour.

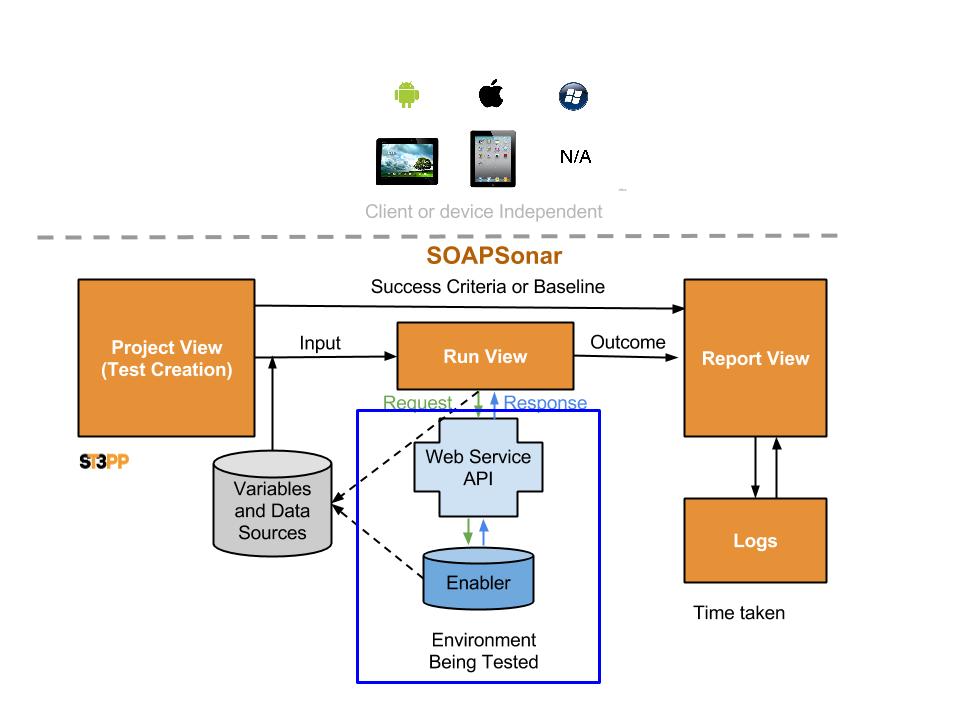
So lets take a look at SOAPSonar’s report view, carrying on from the previous Tutorial #5 defining success criteria.
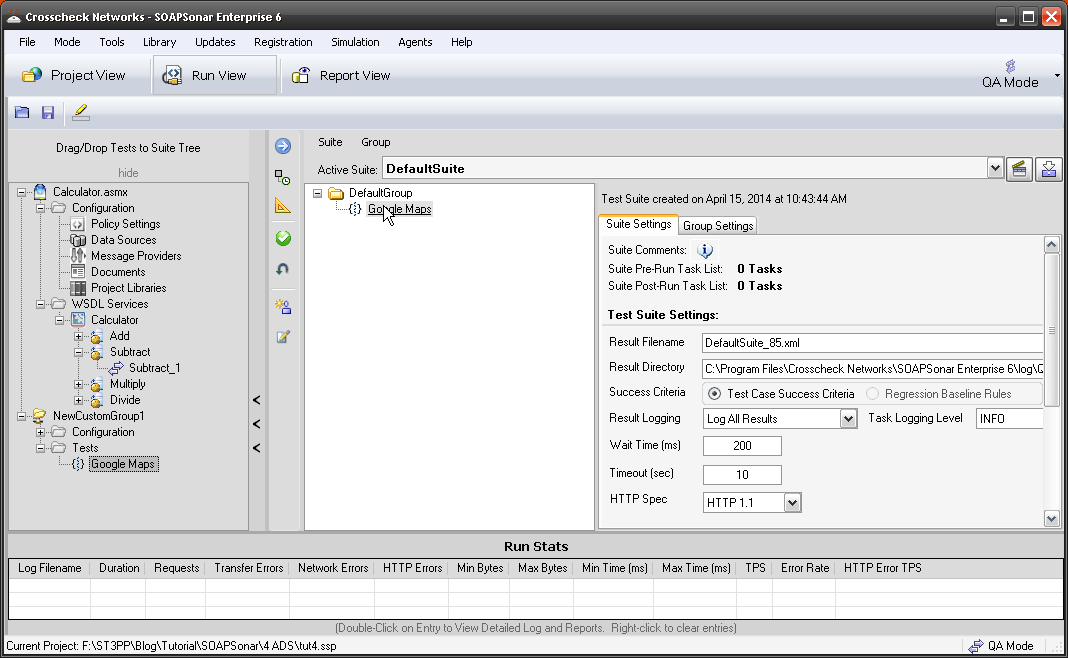
1. Lets start this time with JSON Google maps. In QA Mode, Project View. Please confirm you have the service and the [ADS] and that service works. Switch to Run-View and clear any tests under the DefaultGroup and drag over only the Google Maps test case we did in Tutorial 5.

2. look at the area to the right, In QA Mode there are 2 tabs. Suite Settings, and Group Settings. If you switch to Performance mode, there are 3 different tabs. In QA mode, lets change the Result File name to Tut6_1.xml and leave the location at C:\Program Files\Crosscheck Networks\SOAPSonar Enterprise 6\log\QA. We have not captured a baseline for regression testing, so select Test Case Success Criteria. Result Logging as Log All results and Verbose and Use Optimized XML logging. Warning, Logging all and verbose logs in large test environments can greatly effect performance and seriously load any workstation. We usually recommend log errors fails and errors. HP Quality Centre and other options, leave unselected.

3. On the Group Settings tab, lets leave things default. Here you can define a Data Source table to run through multiple tests. Commit and Run Suite.
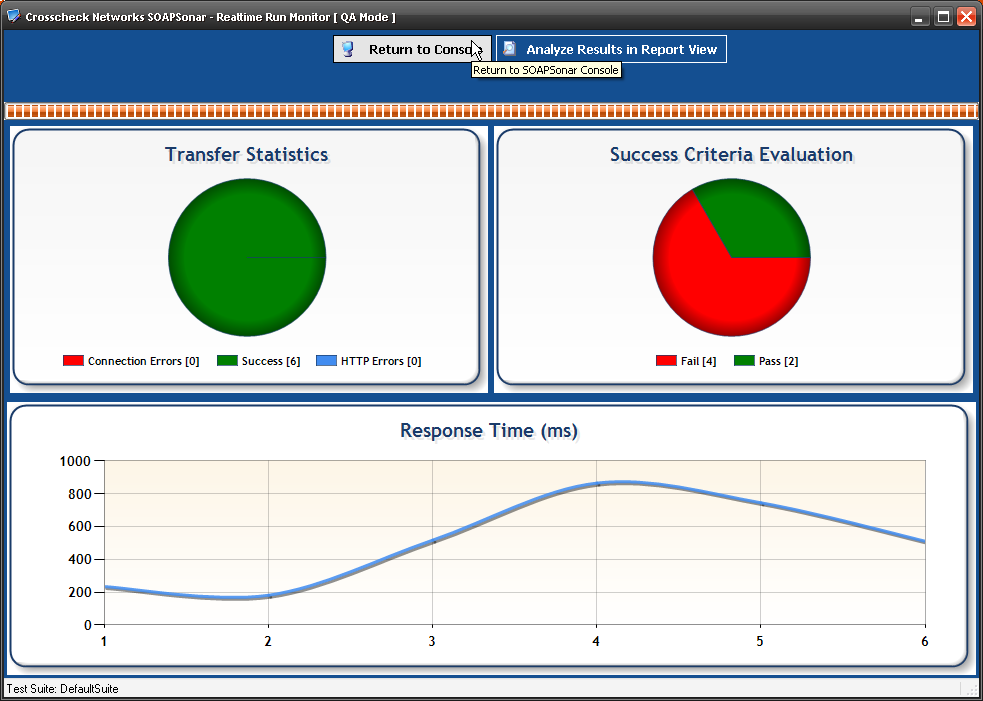
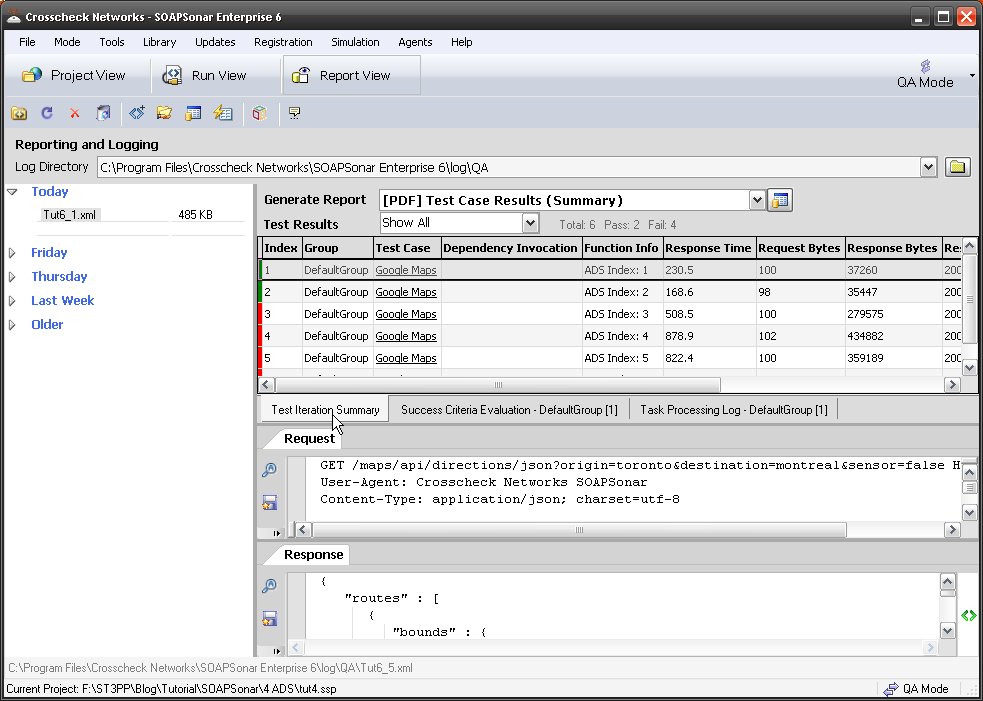
4. Realtime Run Monitor shows that I ran 6 test cases of which 4 failed and 2 passed. Select Analyse Results in Report View at the top of the page.

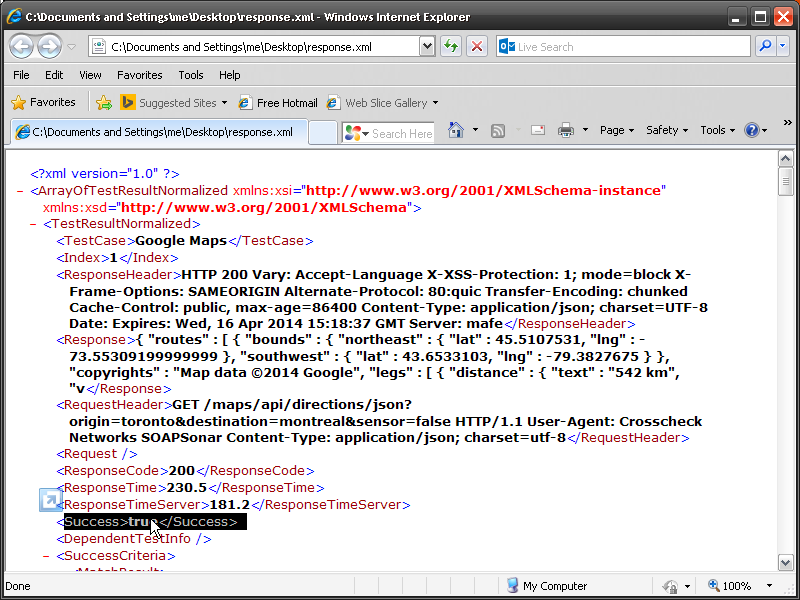
5. In Report View, we can now see on the far left, under Today, I have Tut6_1xml Log file at the location we entered in step 2. Right Clicking on the file allows you to export Request and Response Data as Files and Export Results to Normalized XML. Select Export results in Normalized XML and you have details of each test case run.

6. In the main section you can see the first 2 tests are green and the rest red. Selecting the first test, and the tab Test Iteration Summary and the Request Response Tabs populate with the what was sent and received. Do you notice the exact time for and size of each message is also reported along with teh response code?

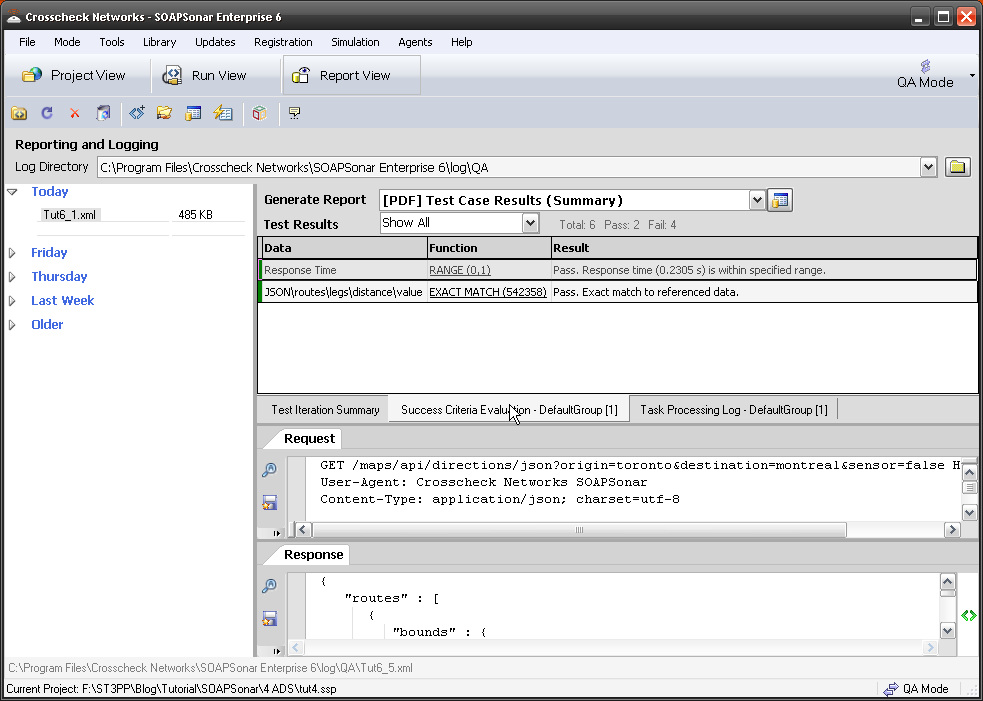
7. Select Success Criteria Evaluation, and you can see the Response time and exact Match rule we created, both were a success.

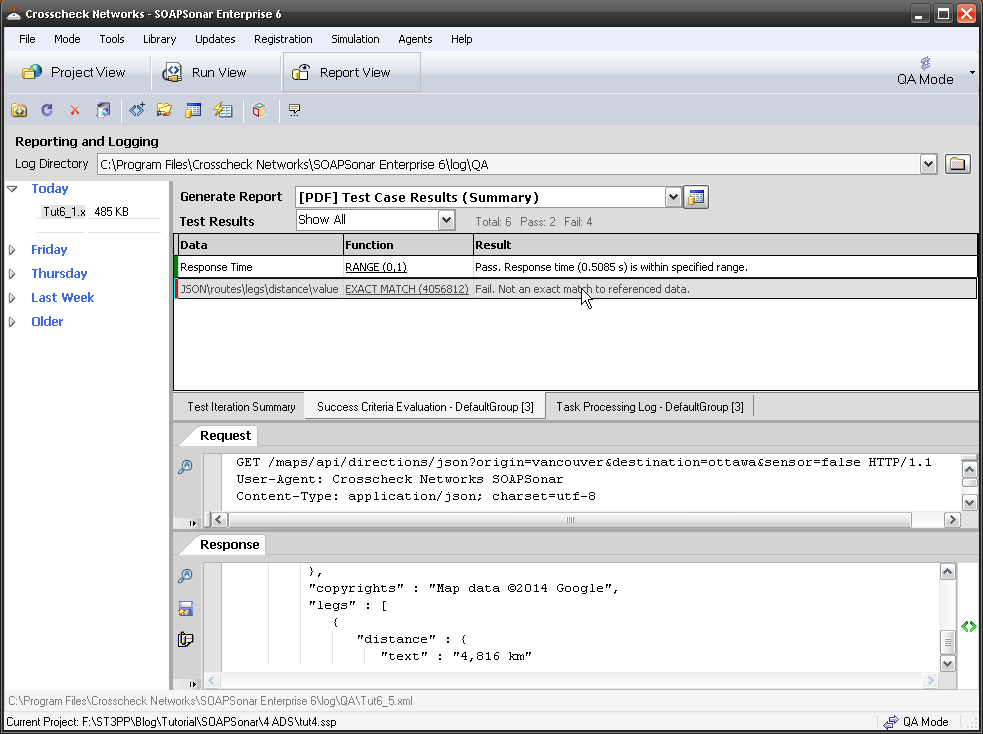
8. If select the 3rd line (first to fail) we see that it used the ADS Index 3rd row) the independent Response time and the response code was 200 (normally a pass). By selecting Success Criteria Evaluation tab, we can see that the exact match success criteria failed. That is, the csv value we were expecting was different from what we received.

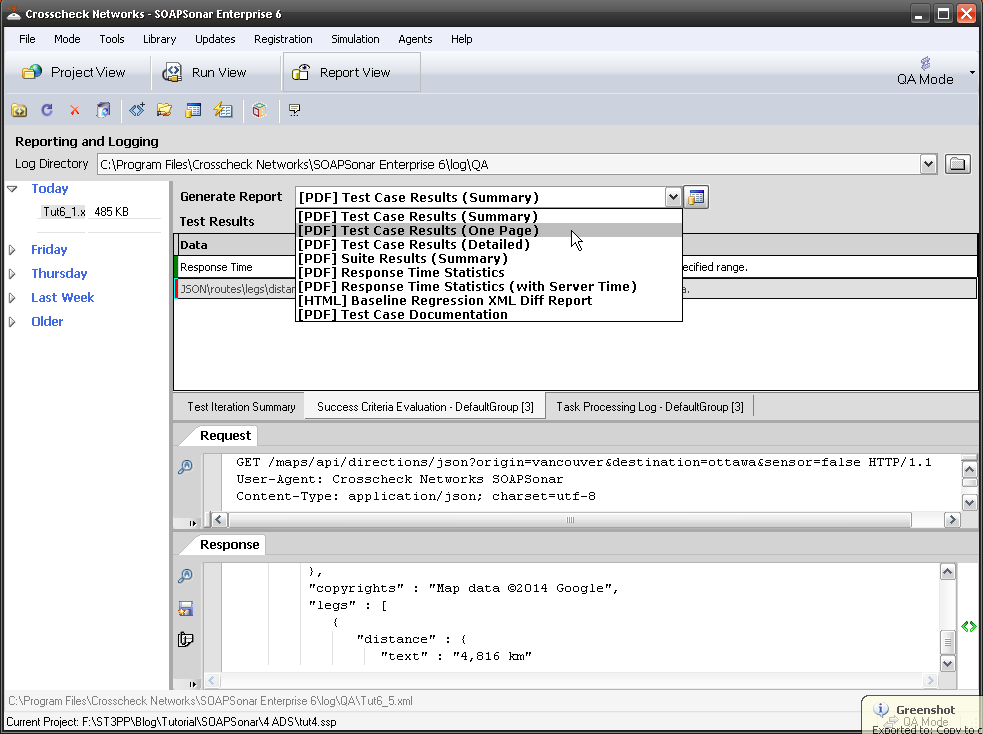
9. We can generate a number of PDF reports via the drop down menu at the top of the page. These PDF reports can also be exported in a variety of formats. Take a look at a few.
10. Running the same test in performance mode and not QA mode, generates an alternate set of reports. The same is true if its is against a baseline.
These results can also be published to HP Quality Center.
Conclusion
Between management level reports and detailed level request and responses, reporting can consume a lot of time. Testers tend to focus on how long it takes to run a manual test vs automate the test cycle, often forgetting about the time taken to generate reports in a manual testing environment and how long it takes to capture and supply the required information with any issues. The ability to supply the test case and log, is key to troubleshooting issues, and the first thing we ask our customers for when they have any technical support questions. That is because automation enables the exact repeat of the same test case, and therefore any issue should be simple to replicate.
Comments?


